ENPH Monthly Technical Analysis
Enphase Energy, Inc
Home energy technology specializing in solutions that manage energy generation, storage, control, and communication through one integrated platform.
ENPH Technical Analysis Summary
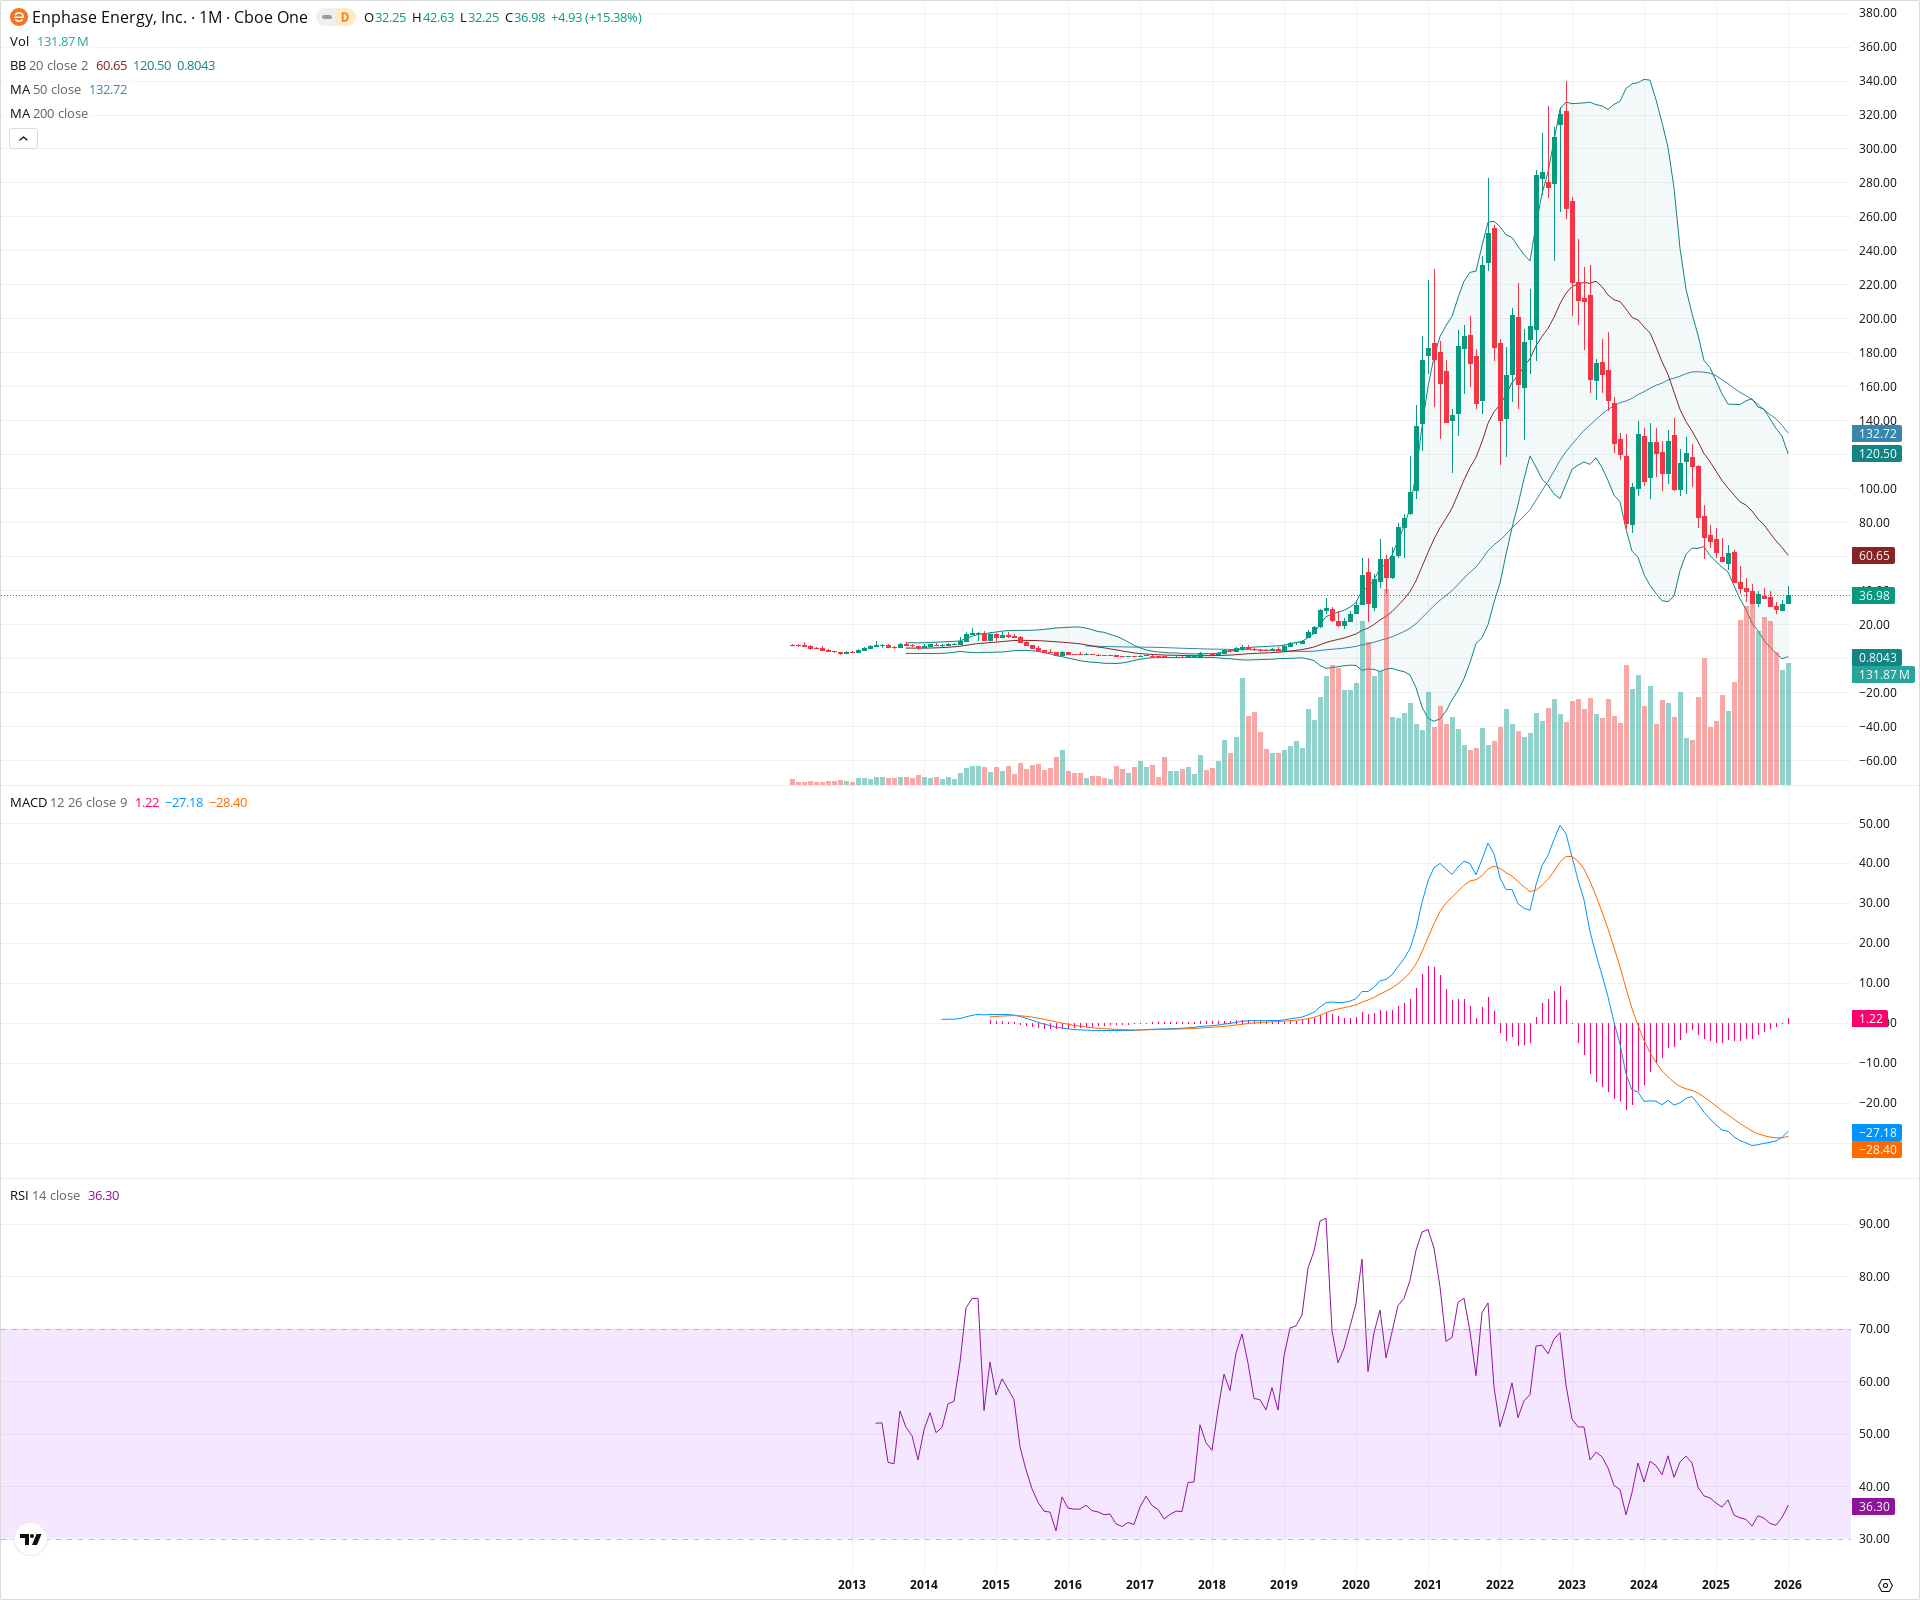
Enphase Energy is technically in a long-term bear market, evidenced by price trading well below the 50-month and 20-month moving averages. However, a significant constructive development is visible with a bullish monthly MACD crossover and a stabilization of price around the $30 historical support zone. While the immediate outlook favors a relief rally, the secular trend remains down until the stock can reclaim the 20-month SMA at approximately $60.
Included In Lists
Related Tickers of Interest
ENPH Monthly Chart
Sentiment
Short-term Sentiment (days to weeks): Bullish
The stock has rebounded sharply (+15.38% on the current candle) from a multi-year support zone. Momentum is shifting positively with the monthly MACD line crossing above the signal line and the histogram turning positive (1.22).
Long-term Sentiment (weeks to months): Bearish
The price remains in a deep secular downtrend, trading significantly below the 20-month SMA (60.65) and 50-month SMA (132.72). The RSI remains below 40 (36.30), indicating the long-term regime is still dominated by sellers despite the recent bounce.
Report Metadata
- Timeframe: monthly
- Generated at: 2026-02-02T06:23:13.610Z
- Model: gemini-3-pro-preview
Support Price Levels
| Level | Range | Strength | Notes |
|---|---|---|---|
| $27.50 | $25.00 - $30.00 | Strong | Recent swing lows that align with the major secular breakout level from 2019. |
| $17.50 | $15.00 - $20.00 | Weak | Historical base consolidation zone prior to the 2020 parabolic advance. |
Resistance Price Levels
| Level | Range | Strength | Notes |
|---|---|---|---|
| $62.83 | $60.65 - $65.00 | Strong | The 20-month SMA (Bollinger Band basis) acts as the first major dynamic resistance level. |
| $136.36 | $132.72 - $140.00 | Strong | The 50-month SMA combined with previous structural support-turned-resistance. |
Potential Chart Patterns in Formation
| Strength | Pattern | Signal | Target | Details |
|---|---|---|---|---|
| Weak | Potential Base Formation | Bullish | $60.65 | After a parabolic collapse from highs, price action has begun to flatten in the $25-$35 range over recent months, suggesting exhaustion of selling pressure. |
Frequently Asked Questions about ENPH
What is the current sentiment for ENPH?
The short-term sentiment for ENPH is currently Bullish because The stock has rebounded sharply (+15.38% on the current candle) from a multi-year support zone. Momentum is shifting positively with the monthly MACD line crossing above the signal line and the histogram turning positive (1.22).. The long-term trend is classified as Bearish.
What are the key support levels for ENPH?
StockDips.AI has identified key support levels for ENPH at $27.50 and $17.50. These levels may represent potential accumulation zones where buying interest could emerge.
Is ENPH in a significant dip or a Value Dip right now?
ENPH has a Value Score of 58/100. It is not currently flagged as a significant dip in the Top Dips list. It is not listed as a Value Dip because the long-term sentiment or value-score threshold does not qualify.
View the full interactive analysis on StockDips.AI.