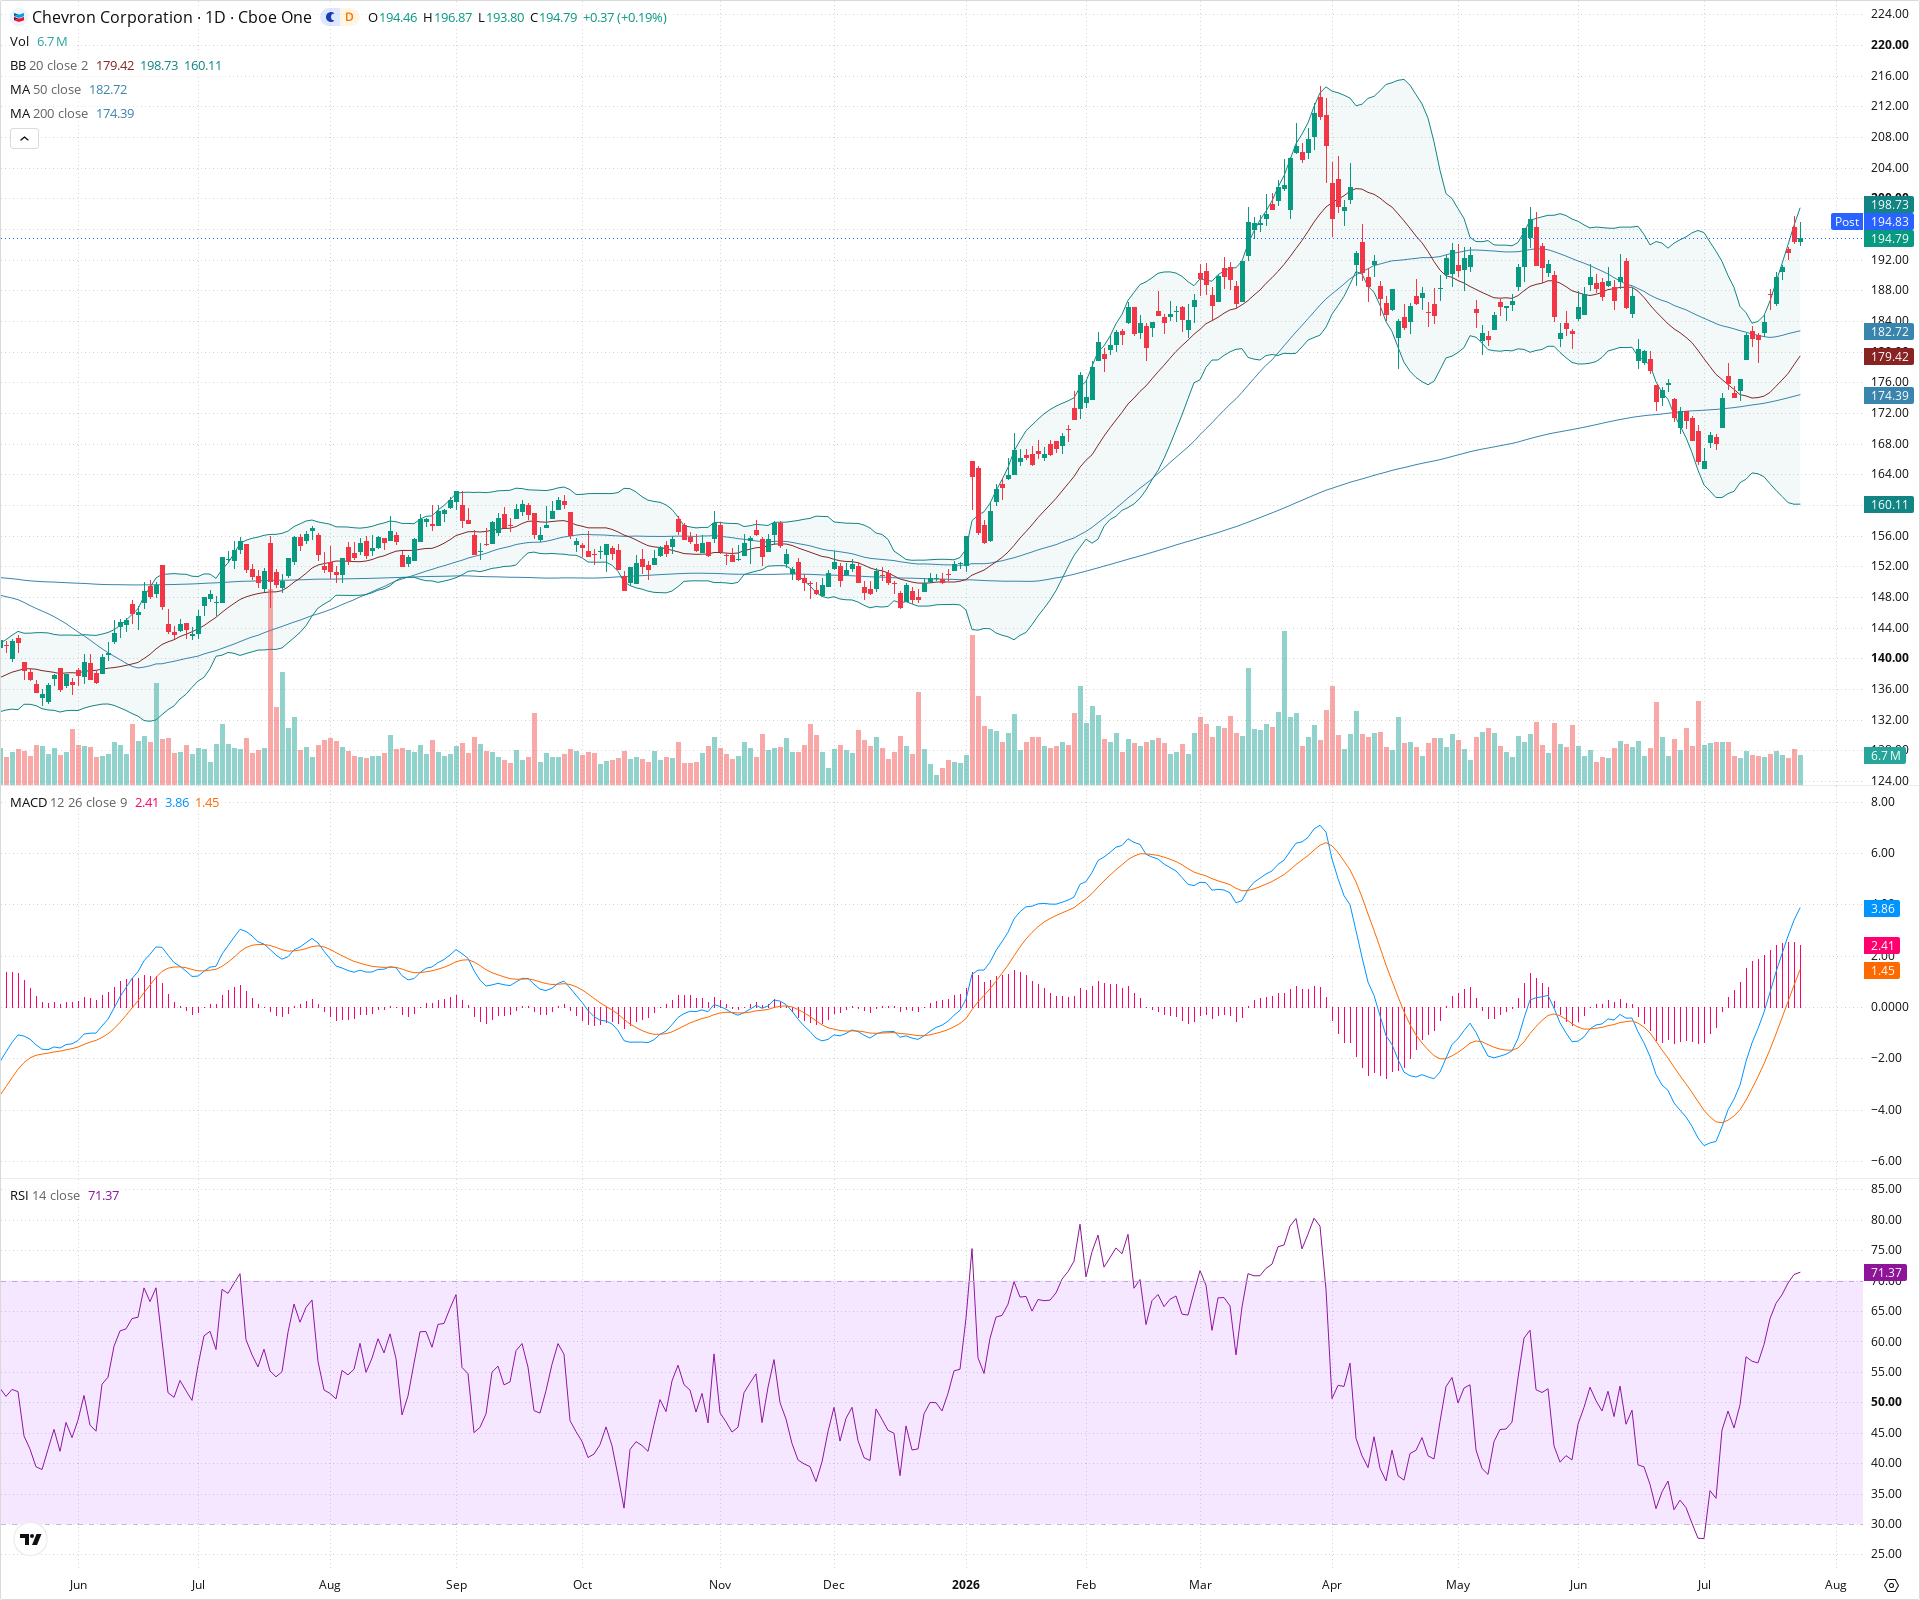
CVX Daily Technical Analysis
Chevron Corporation
Integrated energy and chemical company
CVX Technical Analysis Summary
The technical setup for CVX is strongly bullish across both short and long timeframes. The stock is in a clear uptrend, supported by bullishly aligned moving averages and strong momentum indicators like the MACD. While the RSI is entering overbought territory, suggesting potential for minor near-term consolidation, the overall trajectory favors a retest of previous highs above 210.
Included In Lists
Related Tickers of Interest
CVX Daily Chart
Sentiment
Short-term Sentiment (days to weeks): Bullish
Price is exhibiting strong upward momentum, riding the upper Bollinger Band. MACD is showing a bullish crossover with expanding positive histogram, confirming the short-term strength.
Long-term Sentiment (weeks to months): Bullish
The long-term trend is clearly up. Price is comfortably above the rising 50-day and 200-day moving averages, which are in a bullish alignment.
Report Metadata
- Timeframe: daily
- Generated at: 2026-07-24T21:04:57.020Z
- Model: gemini-3.1-pro-preview
Support Price Levels
| Level | Range | Strength | Notes |
|---|---|---|---|
| $185.00 | $184.00 - $186.00 | Weak | Immediate support zone around recent minor consolidation and near the 20-day SMA. |
| $175.00 | $174.00 - $176.00 | Strong | Significant structural support level aligning with a recent swing low and the 200-day SMA. |
| $165.00 | $164.00 - $166.00 | Strong | Major historical swing low support zone from earlier in the chart. |
Resistance Price Levels
| Level | Range | Strength | Notes |
|---|---|---|---|
| $199.00 | $198.00 - $200.00 | Weak | Near-term resistance at the previous minor swing high before the current leg up. |
| $213.50 | $212.00 - $215.00 | Strong | Major resistance at the prominent prior swing high peak visible on the chart. |
Potential Chart Patterns in Formation
| Strength | Pattern | Signal | Target | Details |
|---|---|---|---|---|
| Strong | Consolidation Breakout / Ascending Trend | Bullish | $212.00 | Price has broken out of a recent pullback/consolidation phase that bottomed near 175, resuming its broader uptrend. |
Frequently Asked Questions about CVX
What is the current sentiment for CVX?
The short-term sentiment for CVX is currently Bullish because Price is exhibiting strong upward momentum, riding the upper Bollinger Band. MACD is showing a bullish crossover with expanding positive histogram, confirming the short-term strength.. The long-term trend is classified as Bullish.
What are the key support levels for CVX?
StockDips.AI has identified key support levels for CVX at $185.00 and $175.00. These levels may represent potential accumulation zones where buying interest could emerge.
Is CVX in a significant dip or a Value Dip right now?
CVX has a Value Score of 31/100. It is not currently flagged as a significant dip in the Top Dips list. It is not listed as a Value Dip because the long-term sentiment or value-score threshold does not qualify.
View the full interactive analysis on StockDips.AI.