GLD Monthly Technical Analysis
SPDR Gold Shares
Tracks the spot price of physical gold bullion held in secure vaults. Roughly ~1/10 oz of gold per share. Often used as a hedge against inflation, currency debasement, geopolitical risk, and financial market stress. Gold is considered a store of value and tends to perform well during risk-off environments.
GLD Technical Analysis Summary
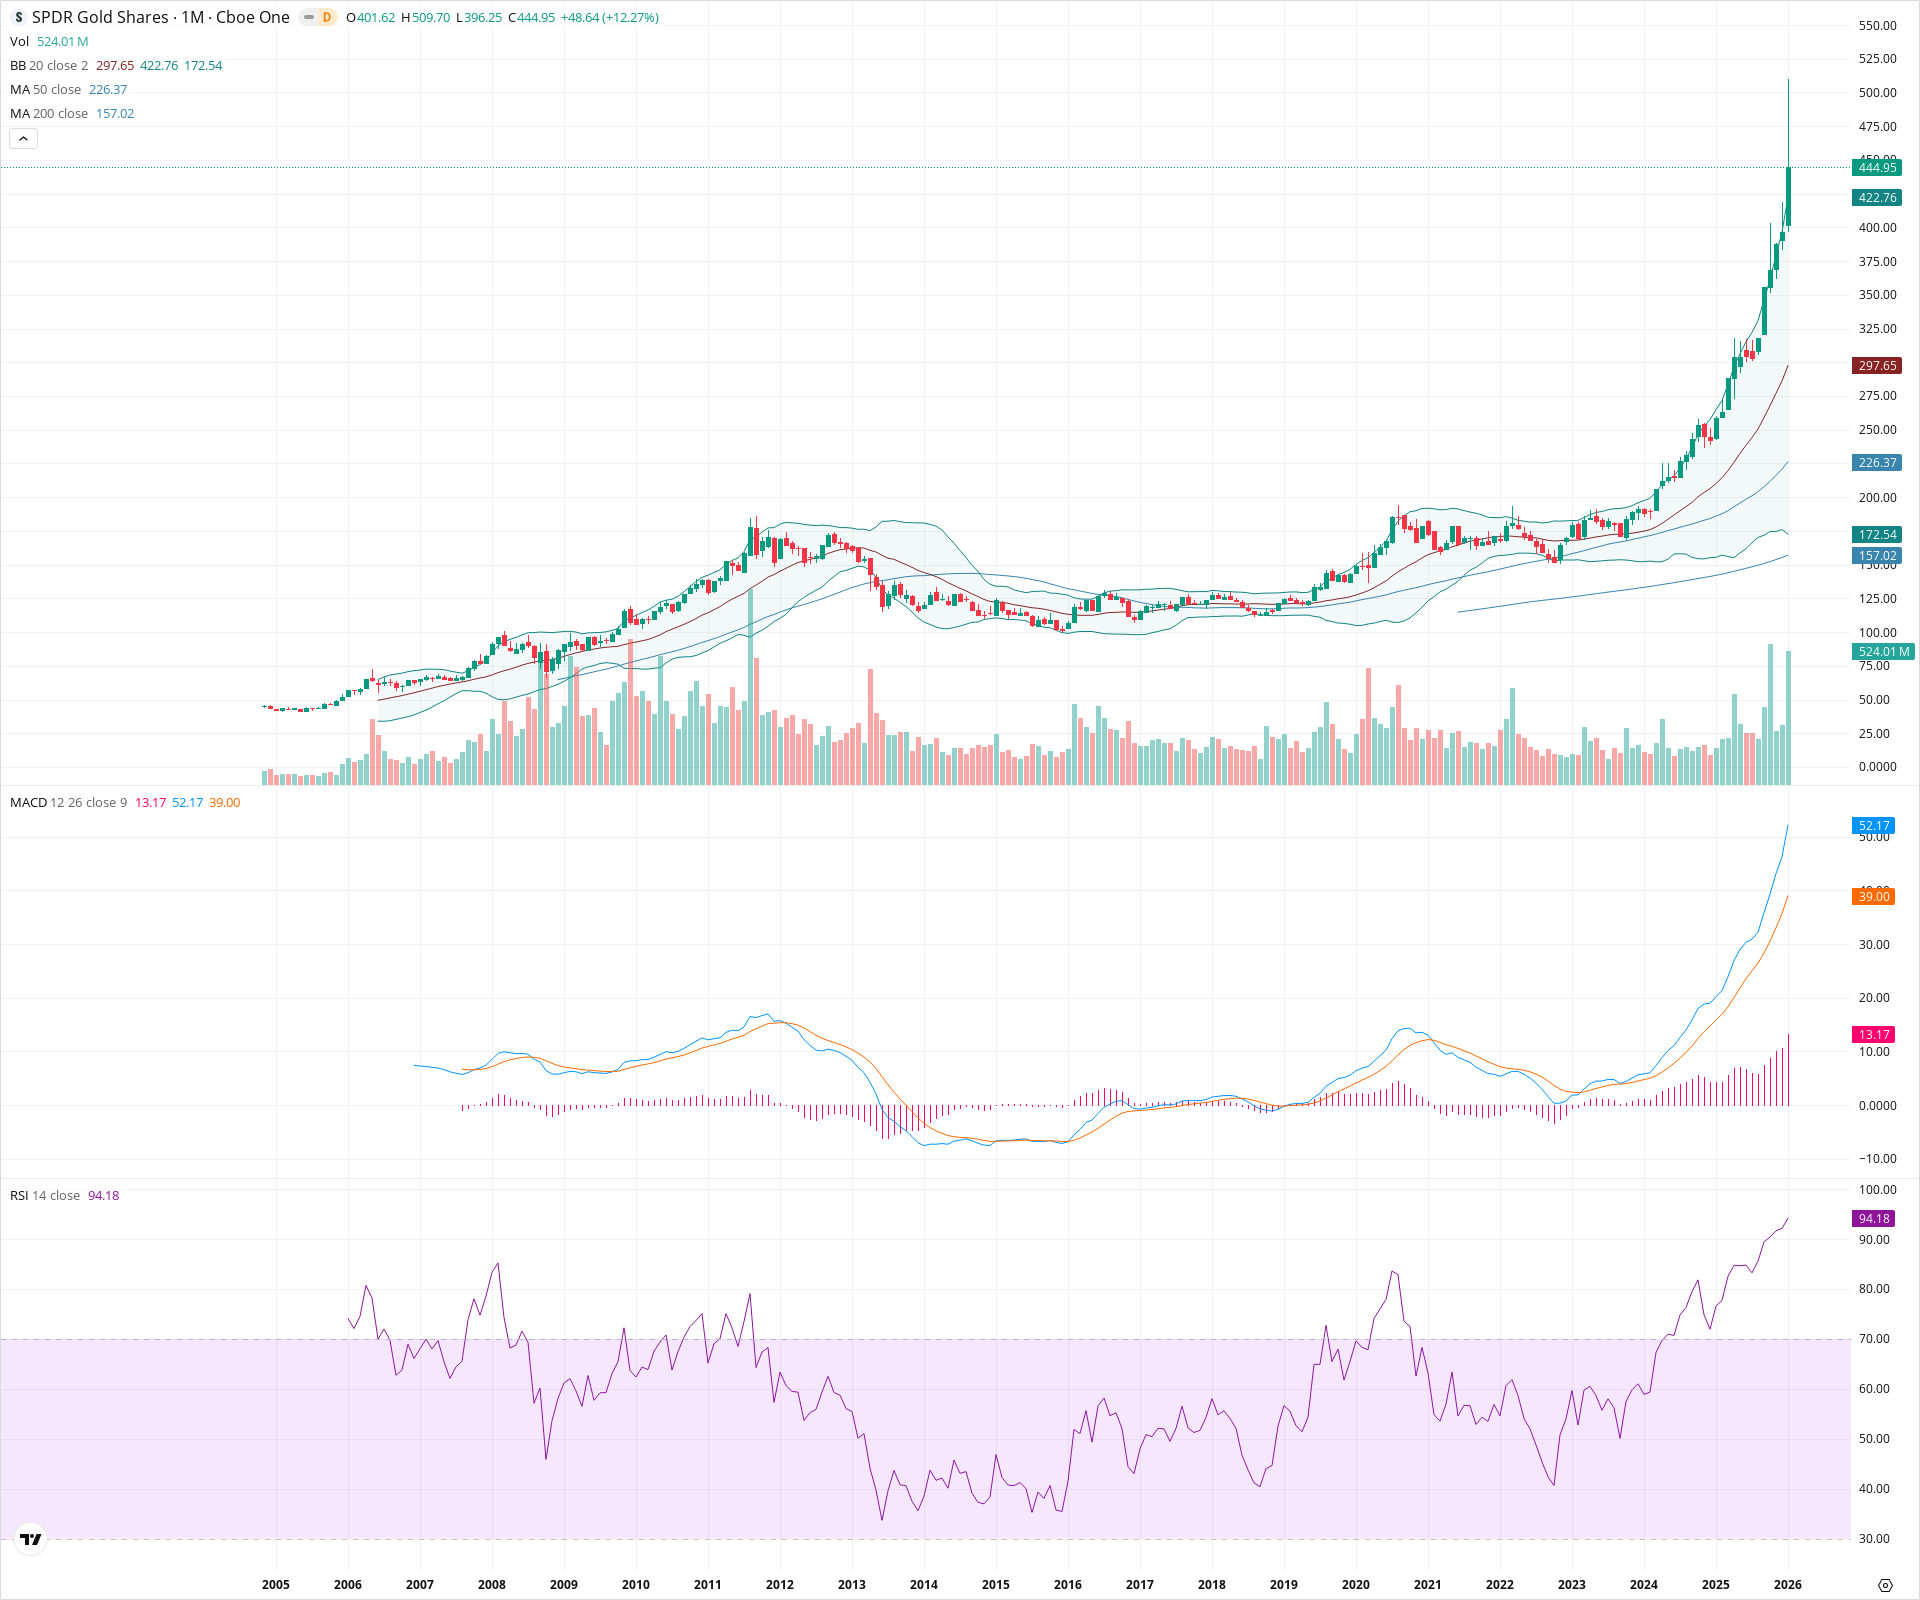
GLD has entered a historic price discovery phase after breaking out of a massive 13-year Cup and Handle pattern. The price is currently parabolic, trading significantly above its upper Bollinger Band with an RSI of 94, indicating extreme overbought conditions that often characterize the most aggressive part of a secular trend. While the long-term outlook remains firmly bullish due to the successful structural breakout, the extreme extension suggests high volatility and potential for mean reversion volatility in the medium term. Major support is firmly established at the previous multi-year highs near 200.
Included In Lists
Related Tickers of Interest
GLD Monthly Chart
Sentiment
Short-term Sentiment (days to weeks): Bullish
Price is in a vertical parabolic discovery phase with extreme momentum (RSI > 94). While the long upper wick on the current monthly candle suggests profit-taking from the 509 high, the trend is intensely positive.
Long-term Sentiment (weeks to months): Bullish
The asset has successfully broken out of a 13-year secular consolidation base (Cup and Handle). All major moving averages (50, 200) are trending upwards, confirming a strong long-term bull regime.
Report Metadata
- Timeframe: monthly
- Generated at: 2026-02-02T07:17:34.487Z
- Model: gemini-3-pro-preview
Support Price Levels
| Level | Range | Strength | Notes |
|---|---|---|---|
| $401.00 | $400.00 - $402.00 | Weak | Immediate support at the current month's opening price. |
| $200.00 | $190.00 - $210.00 | Strong | Major structural support zone formed by the 2011 and 2020 secular highs, now serving as the base of the breakout. |
| $157.50 | $155.00 - $160.00 | Strong | Confluence of the 200-month SMA and the historical long-term consolidation floor. |
Resistance Price Levels
| Level | Range | Strength | Notes |
|---|---|---|---|
| $505.00 | $500.00 - $510.00 | Weak | Recent intra-month high and psychological round number resistance. |
Potential Chart Patterns in Formation
| Strength | Pattern | Signal | Target | Details |
|---|---|---|---|---|
| Strong | Cup and Handle (Secular) | Bullish | N/A | A massive multi-decade base spanning from the 2011 highs to the 2024 breakout. The 'cup' formed from 2011-2020, and the 'handle' consolidated from 2020-2024. |
| Strong | Parabolic Advance | Bullish | N/A | Price has accelerated vertically away from moving averages and Bollinger Bands, indicating a climatic trend phase. |
Frequently Asked Questions about GLD
What is the current sentiment for GLD?
The short-term sentiment for GLD is currently Bullish because Price is in a vertical parabolic discovery phase with extreme momentum (RSI > 94). While the long upper wick on the current monthly candle suggests profit-taking from the 509 high, the trend is intensely positive.. The long-term trend is classified as Bullish.
What are the key support levels for GLD?
StockDips.AI has identified key support levels for GLD at $401.00 and $200.00. These levels may represent potential accumulation zones where buying interest could emerge.
Is GLD in a significant dip or a Value Dip right now?
GLD has a Value Score of 62/100. It is not currently flagged as a significant dip in the Top Dips list. It is not listed as a Value Dip because the long-term sentiment or value-score threshold does not qualify.
View the full interactive analysis on StockDips.AI.