MSFT Monthly Technical Analysis
Microsoft Corporation
Develops software, cloud computing, and AI tools including Windows, Office, and Azure.
MSFT Technical Analysis Summary
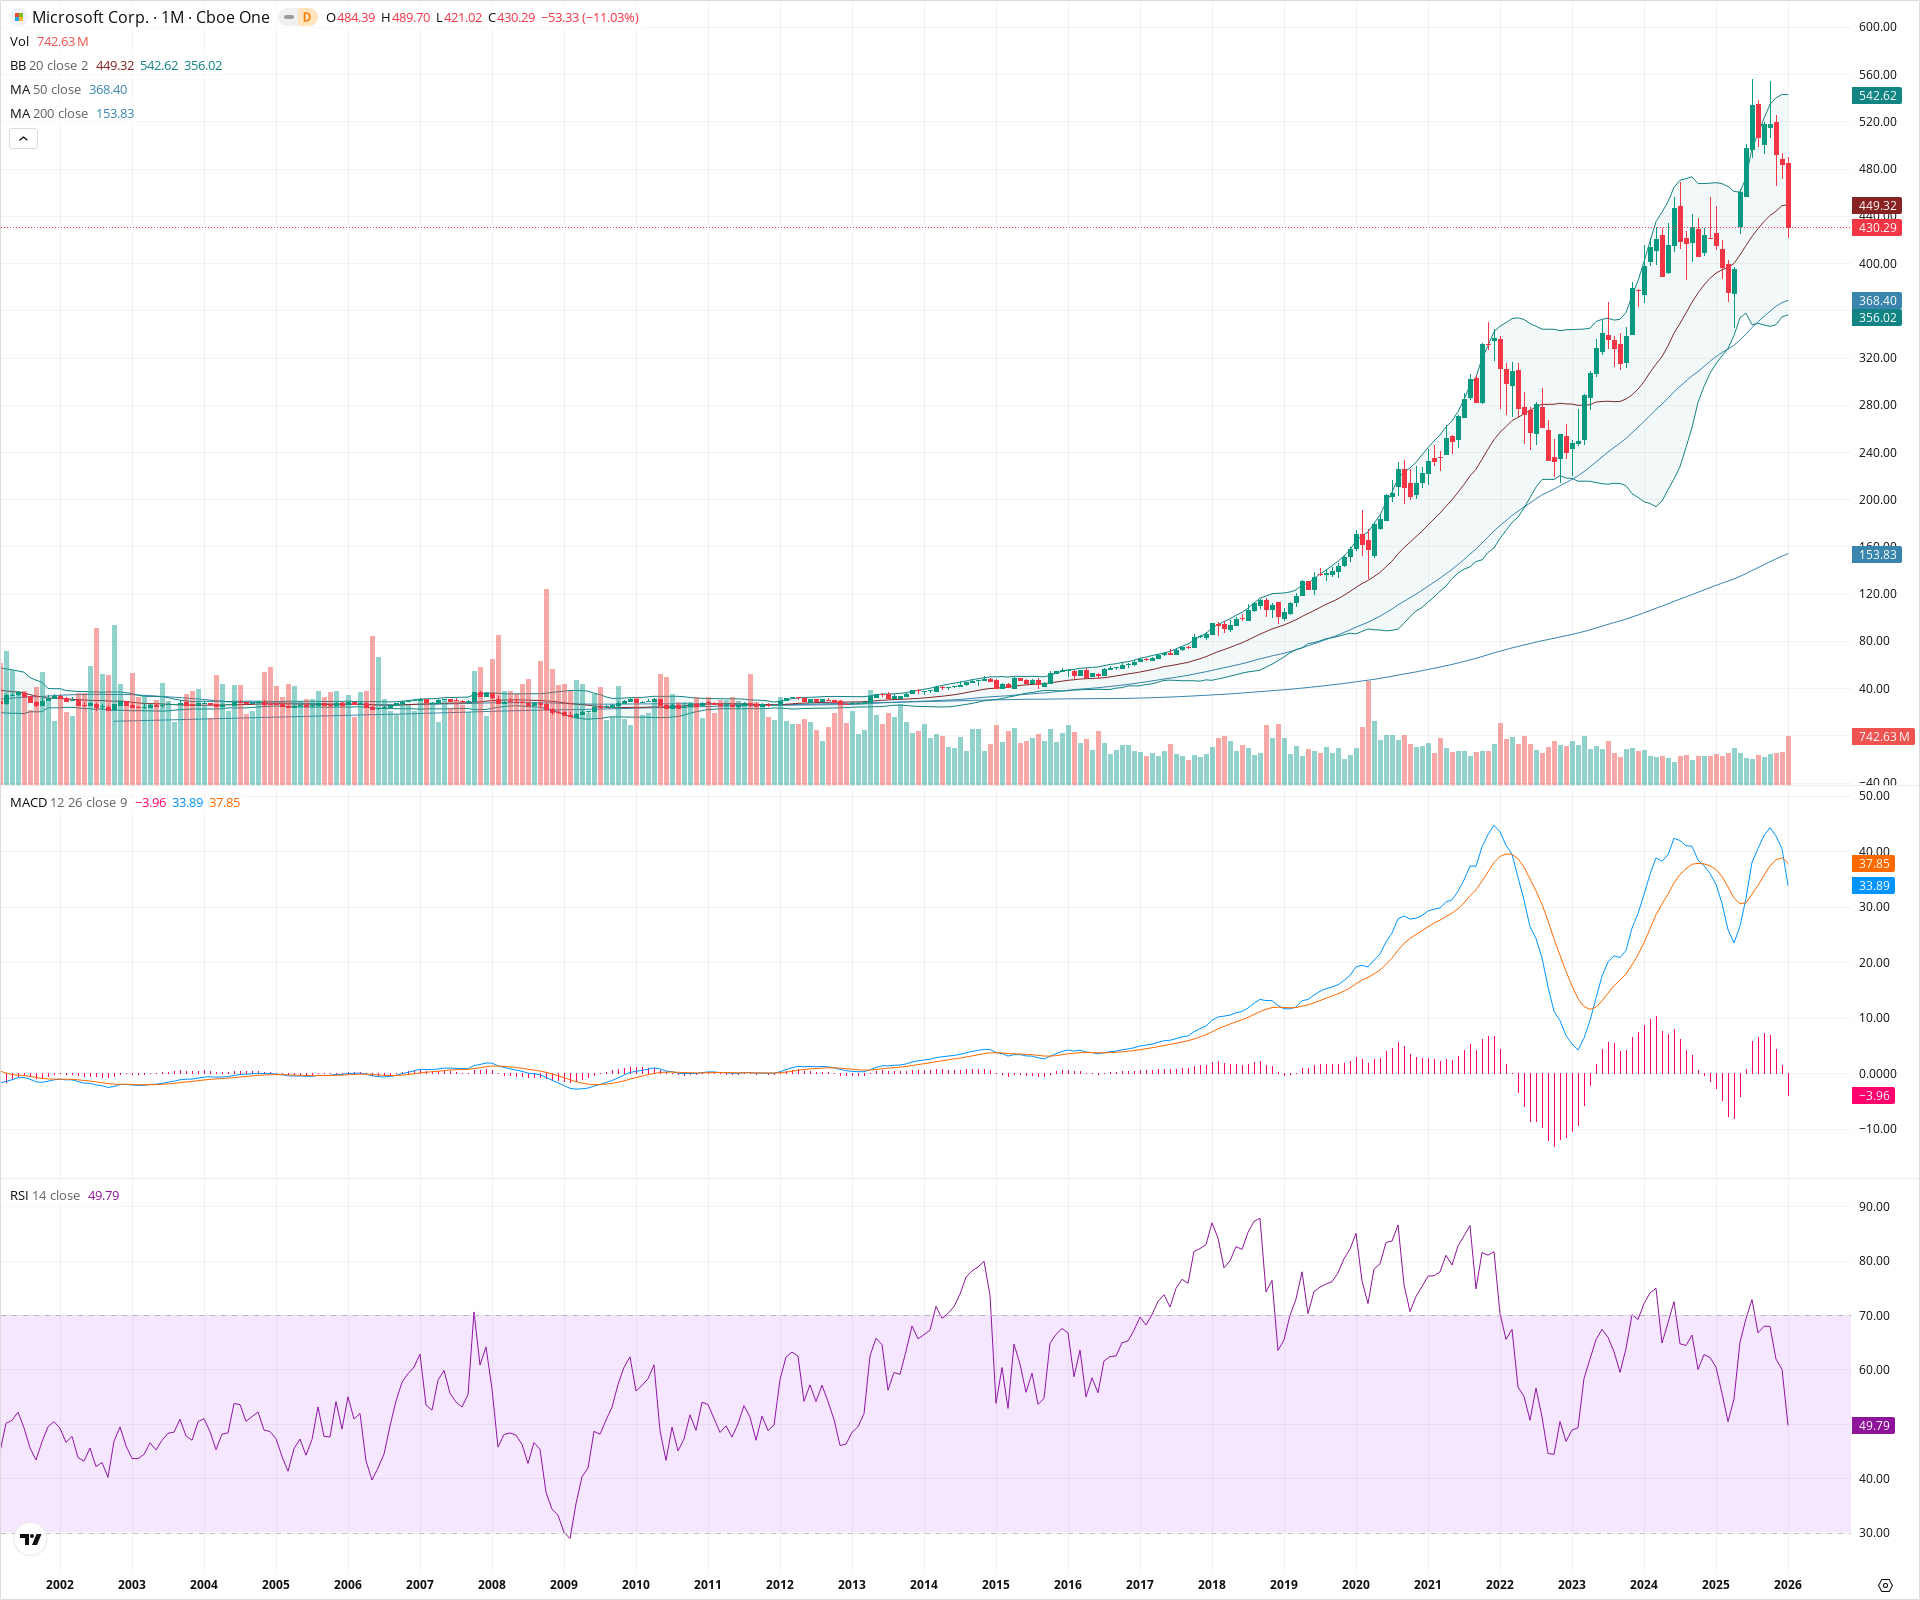
Microsoft remains in a robust secular bull market, evidenced by the price holding well above long-term moving averages. However, the current monthly candle indicates a sharp short-term correction, confirmed by a bearish MACD crossover and divergence on the RSI. Long-term investors may view the zone around the 50-month SMA as a critical structural test if the pullback deepens.
Included In Lists
Related Tickers of Interest
MSFT Monthly Chart
Sentiment
Short-term Sentiment (days to weeks): Bearish
Recent bearish MACD crossover (MACD line below Signal line), significant monthly price drop of over 11%, and RSI retreating sharply from overbought territory.
Long-term Sentiment (weeks to months): Bullish
Secular uptrend remains intact with price positioned well above the rising 50-month and 200-month SMAs, showing a consistent structure of higher highs and higher lows over the last decade.
Report Metadata
- Timeframe: monthly
- Generated at: 2026-02-02T06:46:24.035Z
- Model: gemini-3-pro-preview
Support Price Levels
| Level | Range | Strength | Notes |
|---|---|---|---|
| $365.00 | $360.00 - $370.00 | Strong | Confluence of the rising 50-month SMA (currently ~368) and the major structural resistance-turned-support from the 2021 highs. |
| $222.50 | $215.00 - $230.00 | Strong | Major swing low established during the 2022 correction. |
Resistance Price Levels
| Level | Range | Strength | Notes |
|---|---|---|---|
| $467.50 | $465.00 - $470.00 | Strong | Zone of recent monthly closing highs prior to the current correction. |
| $489.50 | $489.00 - $490.00 | Strong | All-time high wick resistance. |
Potential Chart Patterns in Formation
| Strength | Pattern | Signal | Target | Details |
|---|---|---|---|---|
| Strong | Bearish RSI Divergence | Bearish | N/A | While price made higher highs in 2024 compared to 2021, the RSI made lower highs, indicating waning long-term momentum. |
| Strong | Secular Bull Channel | Bullish | N/A | A well-defined multi-year uptrend supported by the 50-month moving average. |
Frequently Asked Questions about MSFT
What is the current sentiment for MSFT?
The short-term sentiment for MSFT is currently Bearish because Recent bearish MACD crossover (MACD line below Signal line), significant monthly price drop of over 11%, and RSI retreating sharply from overbought territory.. The long-term trend is classified as Bullish.
What are the key support levels for MSFT?
StockDips.AI has identified key support levels for MSFT at $365.00 and $222.50. These levels may represent potential accumulation zones where buying interest could emerge.
Is MSFT in a significant dip or a Value Dip right now?
MSFT has a Value Score of 63/100. It is not currently flagged as a significant dip in the Top Dips list. It is not listed as a Value Dip because the long-term sentiment or value-score threshold does not qualify.
View the full interactive analysis on StockDips.AI.