MSTR Weekly Technical Analysis
MicroStrategy Inc
Enterprise analytics firm widely known for holding significant Bitcoin on its balance sheet.
MSTR Technical Analysis Summary
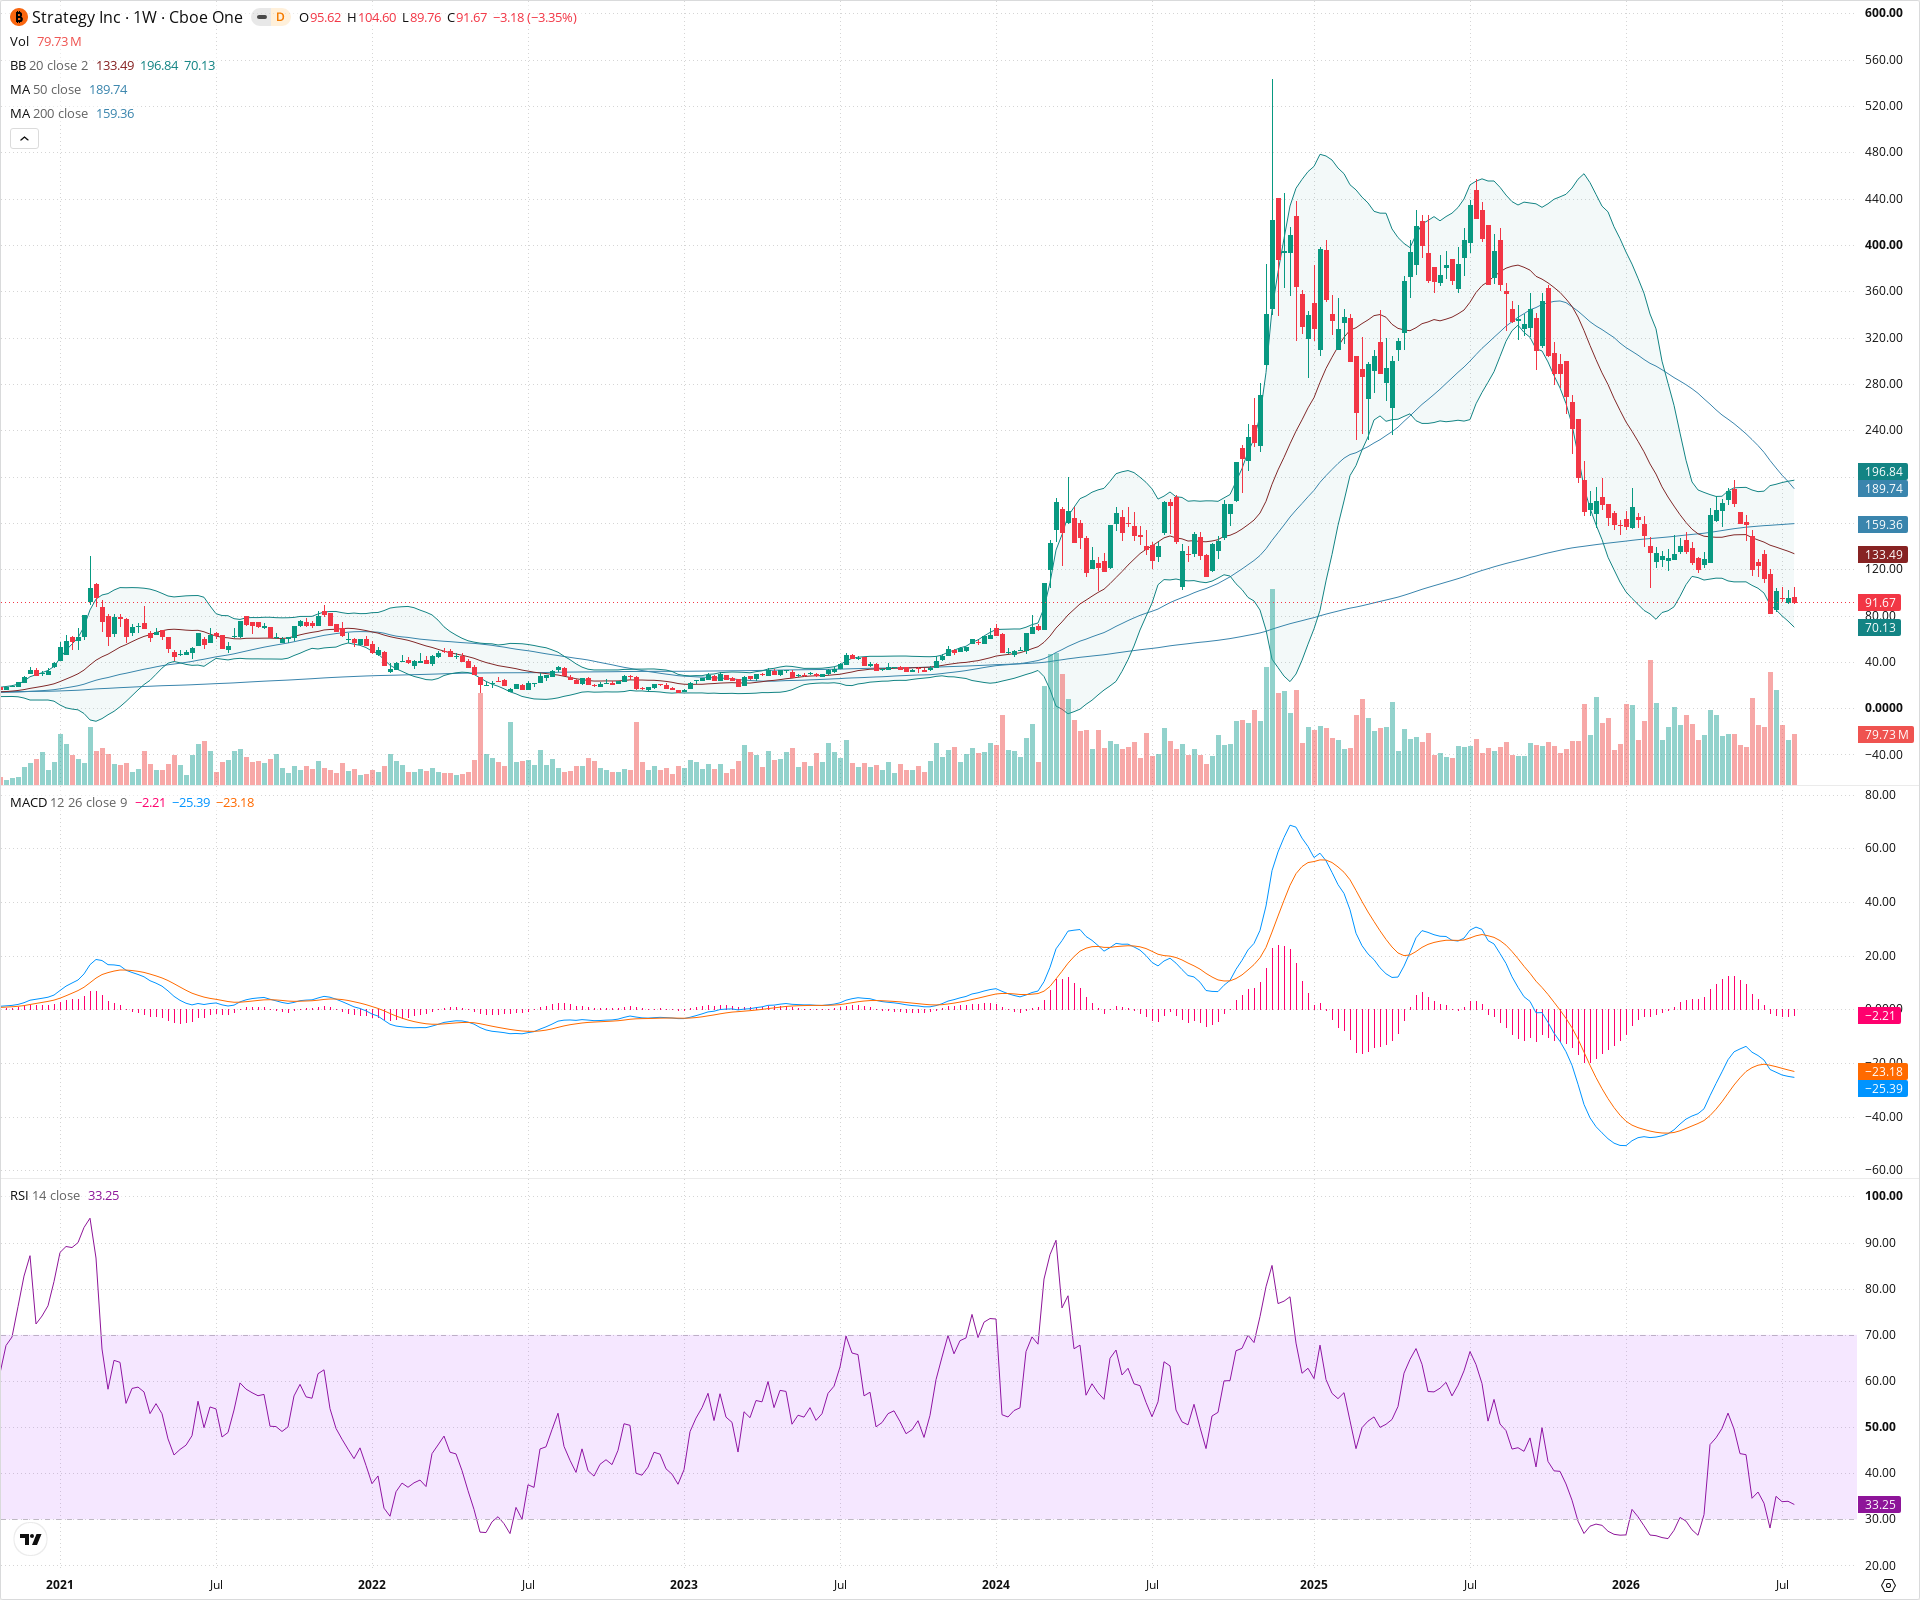
The weekly chart presents a heavily bearish technical picture following a massive historical peak. The asset has suffered a severe, sustained downtrend, breaking through critical support levels and all major moving averages. Momentum indicators like MACD remain deeply negative, and the recent 50/200-week death cross confirms long-term weakness. The price is currently falling toward a major historical base zone between 60 and 80, which will be the next critical test for long-term support.
Included In Lists
Related Tickers of Interest
MSTR Weekly Chart
Sentiment
Short-term Sentiment (days to weeks): Bearish
Price is in a steep, sustained downtrend, recently breaking below a consolidation zone. It trades well below the declining 20-week SMA, with a negative and expanding MACD histogram.
Long-term Sentiment (weeks to months): Bearish
The chart shows a massive topping structure that has fully broken down. The long-term trend has reversed, confirmed by the 50-week SMA crossing below the 200-week SMA (death cross) and price making consistent multi-month lower highs and lower lows.
Report Metadata
- Timeframe: weekly
- Generated at: 2026-07-25T09:09:13.001Z
- Model: gemini-3.1-pro-preview
Support Price Levels
| Level | Range | Strength | Notes |
|---|---|---|---|
| $70.00 | $60.00 - $80.00 | Strong | Major historical consolidation and base building zone prior to the massive historical bull run. |
| $40.00 | $35.00 - $45.00 | Strong | Absolute historical lows visible on the far left of the chart. |
Resistance Price Levels
| Level | Range | Strength | Notes |
|---|---|---|---|
| $127.50 | $120.00 - $135.00 | Strong | Recent breakdown level from a multi-month consolidation, now acting as overhead resistance. Coincides with the declining 20-week SMA. |
| $175.00 | $160.00 - $190.00 | Strong | Major confluence zone of the 50-week and 200-week SMAs, marking a significant structural breakdown level. |
Potential Chart Patterns in Formation
| Strength | Pattern | Signal | Target | Details |
|---|---|---|---|---|
| Strong | Death Cross | Bearish | N/A | The 50-week SMA has crossed below the 200-week SMA, confirming a shift to a long-term bearish trend regime. |
| Strong | Sustained Downtrend / Bubble Burst | Bearish | N/A | A massive parabolic run-up followed by a complete structural breakdown, with price systematically taking out all previous higher-low supports. |
Frequently Asked Questions about MSTR
What is the current sentiment for MSTR?
The short-term sentiment for MSTR is currently Bearish because Price is in a steep, sustained downtrend, recently breaking below a consolidation zone. It trades well below the declining 20-week SMA, with a negative and expanding MACD histogram.. The long-term trend is classified as Bearish.
What are the key support levels for MSTR?
StockDips.AI has identified key support levels for MSTR at $70.00 and $40.00. These levels may represent potential accumulation zones where buying interest could emerge.
Is MSTR in a significant dip or a Value Dip right now?
MSTR has a Value Score of 79/100. It is currently flagged as a significant dip in the Top Dips list. It is not listed as a Value Dip because the long-term sentiment or value-score threshold does not qualify.
View the full interactive analysis on StockDips.AI.