MSTR Monthly Technical Analysis
MicroStrategy Inc
Enterprise analytics firm widely known for holding significant Bitcoin on its balance sheet.
MSTR Technical Analysis Summary
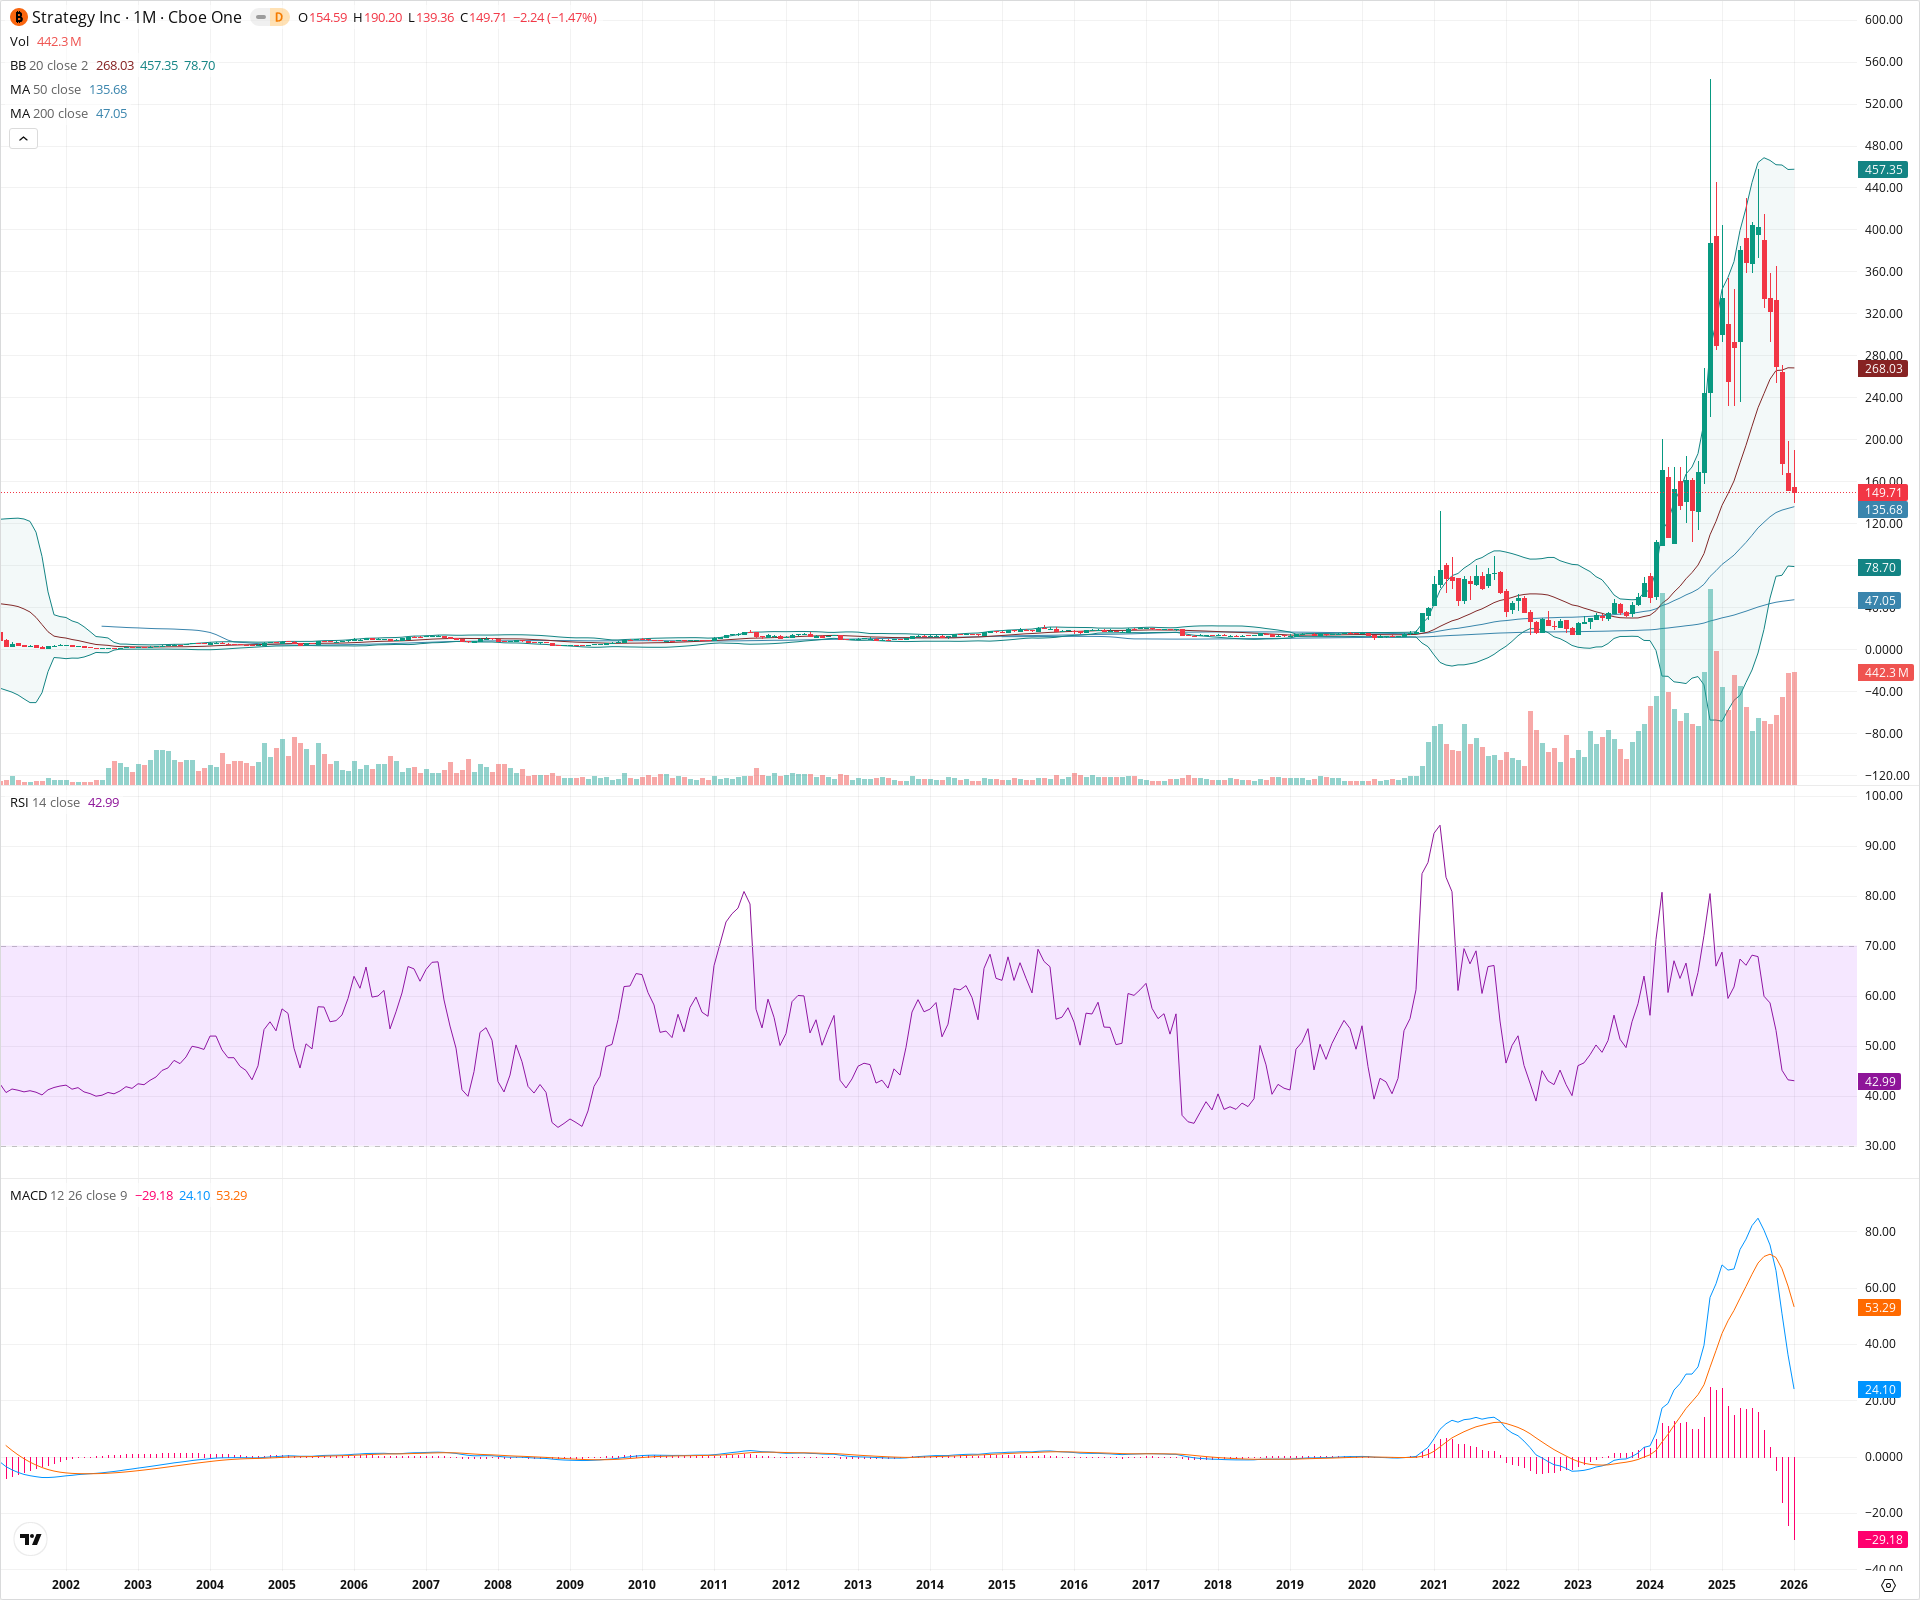
MSTR is undergoing a severe mean reversion event, having retraced approximately 70% from its recent parabolic peak to test critical support at the 50-month SMA (~135). Short-term momentum is deeply negative with a confirmed bearish MACD crossover and RSI dropping towards the bearish threshold. The long-term outlook hinges on the price's ability to stabilize above the 130-140 zone; a failure here would risk a deeper regression to the 200-month SMA, while holding this level could establish a higher secular low.
Included In Lists
Related Tickers of Interest
MSTR Monthly Chart
Sentiment
Short-term Sentiment (days to weeks): Bearish
Price is in a deep corrective downtrend, trading significantly below the 20-month SMA. Momentum indicators are negative, with the MACD histogram expanding downwards and RSI falling sharply towards the 40 level.
Long-term Sentiment (weeks to months): Neutral
While the secular trend (200-month SMA) is rising, the asset has suffered a massive ~70% drawdown from recent highs. It is currently testing a critical make-or-break support level at the 50-month SMA. Holding this level is essential to maintain a long-term bullish structure.
Report Metadata
- Timeframe: monthly
- Generated at: 2026-02-02T06:46:53.762Z
- Model: gemini-3-pro-preview
Support Price Levels
| Level | Range | Strength | Notes |
|---|---|---|---|
| $135.00 | $130.00 - $140.00 | Strong | Confluence of the 50-month SMA (135.68) and the structural lows from the 2022 consolidation base. |
| $53.50 | $47.00 - $60.00 | Strong | Major secular support defined by the 200-month SMA and the pre-breakout trading range from 2020. |
Resistance Price Levels
| Level | Range | Strength | Notes |
|---|---|---|---|
| $265.00 | $260.00 - $270.00 | Strong | The 20-month SMA (Bollinger Band basis) acts as the primary overhead trend resistance. |
| $330.00 | $320.00 - $340.00 | Weak | Previous cycle high from 2021 acting as a structural pivot. |
| $517.50 | $500.00 - $535.00 | Strong | Recent all-time high and peak of the parabolic extension. |
Potential Chart Patterns in Formation
| Strength | Pattern | Signal | Target | Details |
|---|---|---|---|---|
| Strong | Parabolic Retracement | Bearish | $135.00 | After a vertical ascent to highs near 530, price has collapsed back to the breakout base area. |
| Strong | Secular Base Test | Neutral | N/A | Price is retesting the upper boundary of the multi-year base formed between 2021 and 2023. |
Frequently Asked Questions about MSTR
What is the current sentiment for MSTR?
The short-term sentiment for MSTR is currently Bearish because Price is in a deep corrective downtrend, trading significantly below the 20-month SMA. Momentum indicators are negative, with the MACD histogram expanding downwards and RSI falling sharply towards the 40 level.. The long-term trend is classified as Neutral.
What are the key support levels for MSTR?
StockDips.AI has identified key support levels for MSTR at $135.00 and $53.50. These levels may represent potential accumulation zones where buying interest could emerge.
Is MSTR in a significant dip or a Value Dip right now?
MSTR has a Value Score of 79/100. It is currently flagged as a significant dip in the Top Dips list. It is not listed as a Value Dip because the long-term sentiment or value-score threshold does not qualify.
View the full interactive analysis on StockDips.AI.