OKLO Monthly Technical Analysis
Oklo Inc
Advanced nuclear energy company developing small, fast-spectrum nuclear reactors designed to provide long-duration, carbon-free power for data centers, industrial users, and remote locations. Known for its focus on AI-driven energy demand and high-profile backers.
OKLO Technical Analysis Summary
OKLO has executed a dramatic parabolic breakout from a long-term consolidation base around $10, entering a volatile price discovery phase. While the long-term trend is undeniably bullish with support from rising moving averages, the current monthly candle displays a long upper wick (rejection from $115), suggesting immediate exhaustion and a potential cooling off period. Investors should watch for a reaction near the $48 level (20 SMA) if the pullback continues, as the MACD remains bullish but the RSI has retreated sharply from overbought levels.
Included In Lists
Related Tickers of Interest
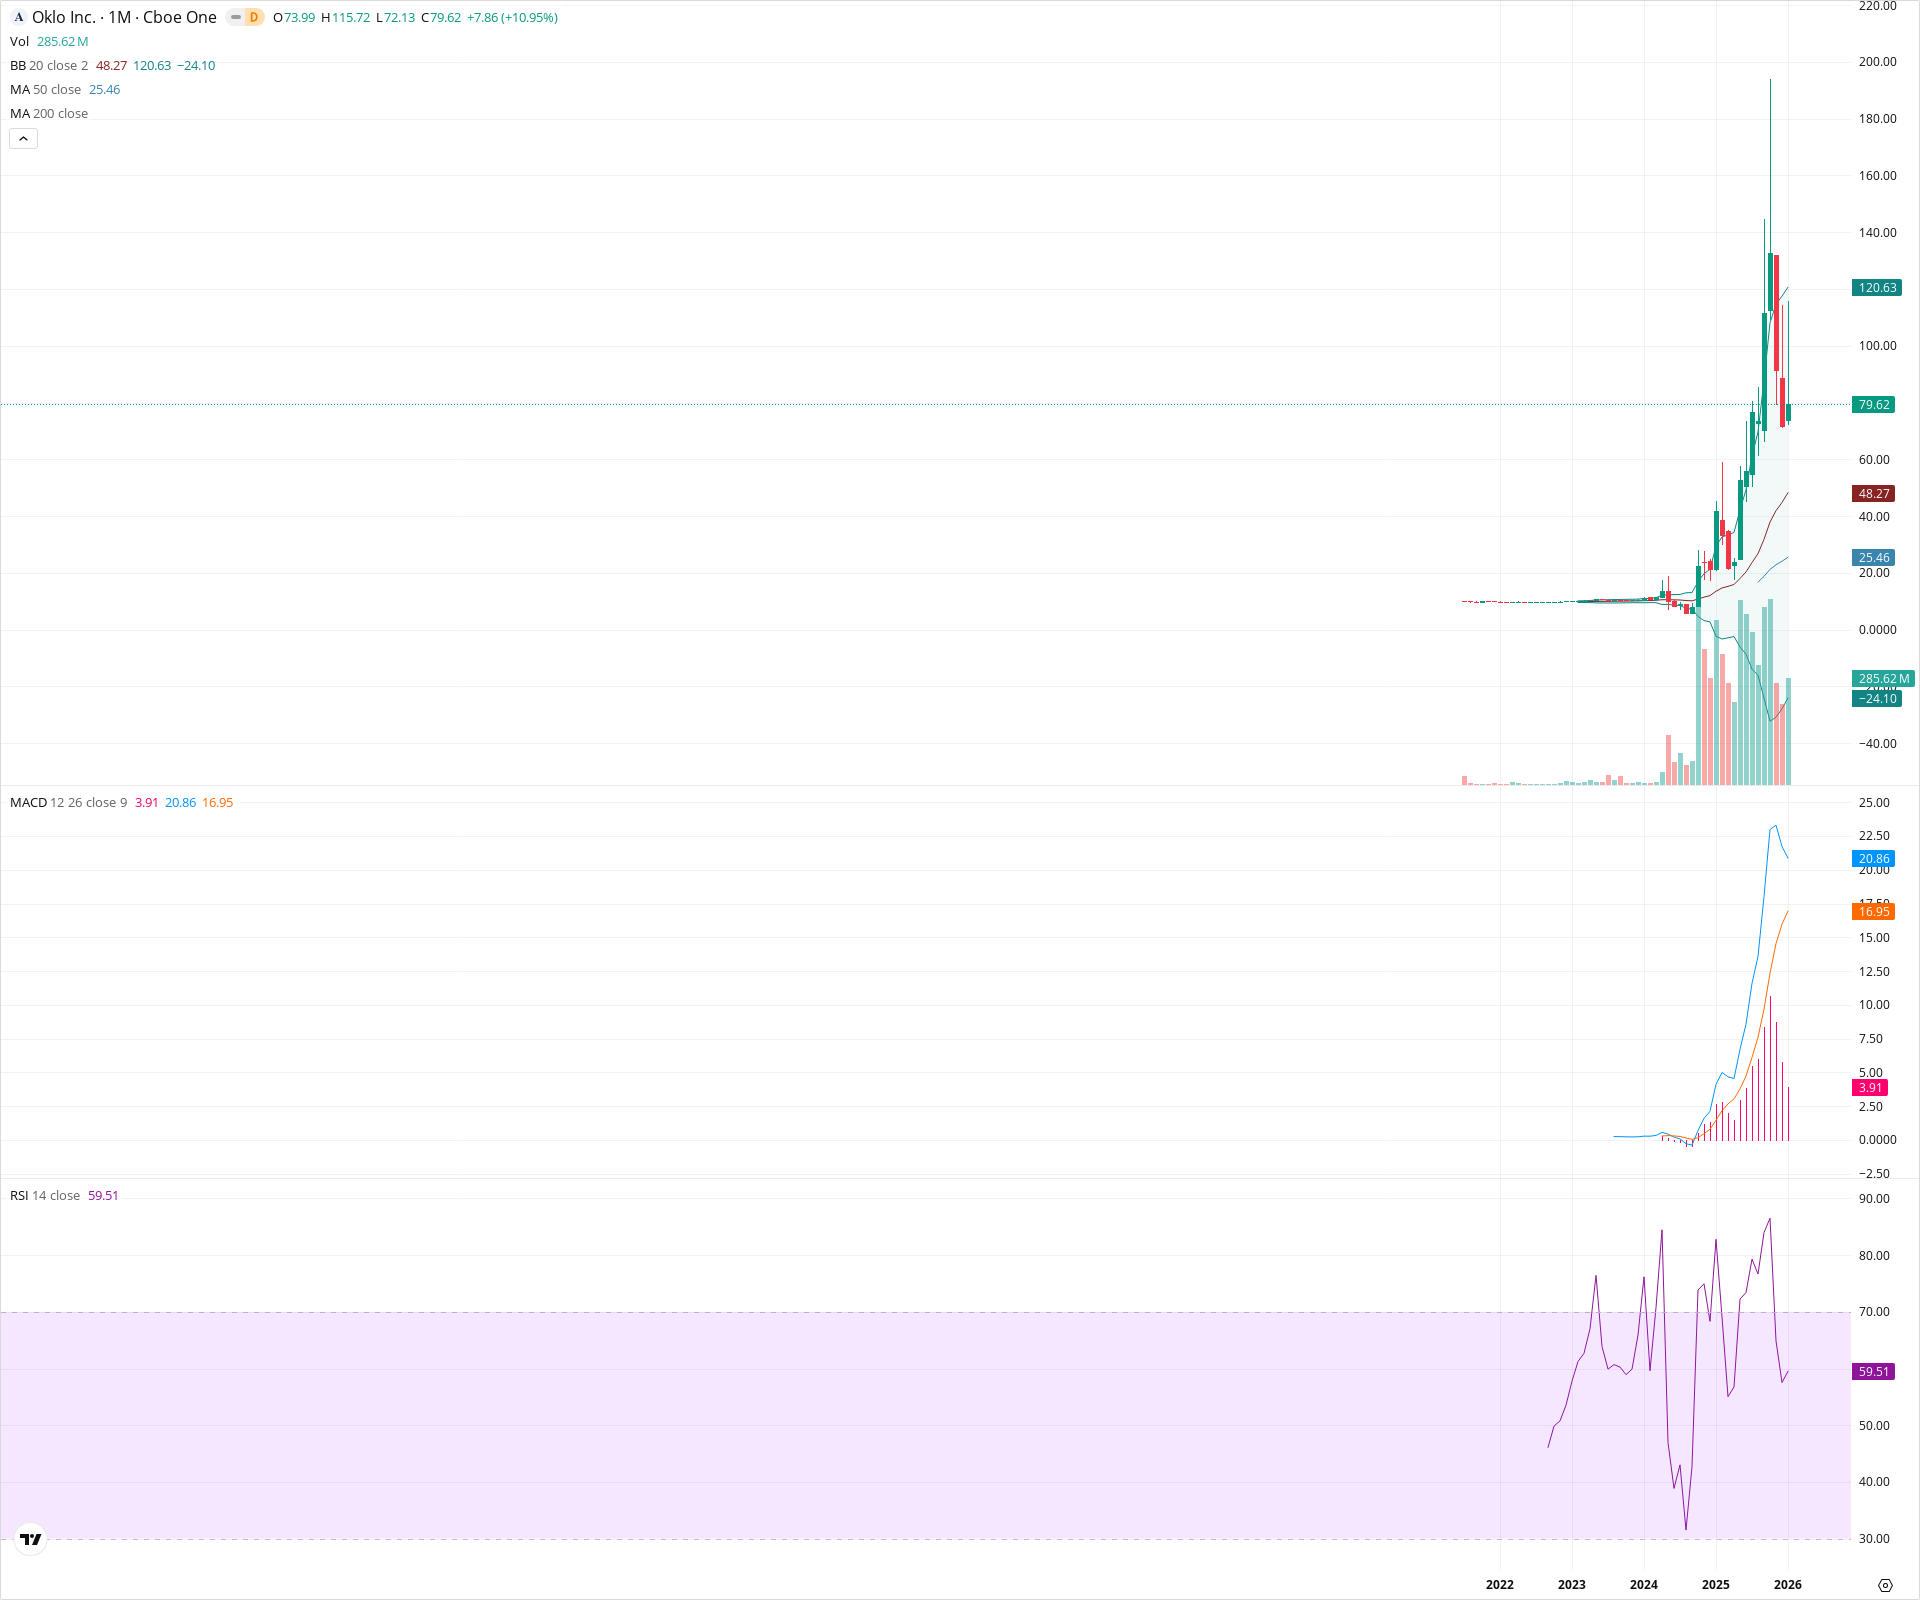
OKLO Monthly Chart
Sentiment
Short-term Sentiment (days to weeks): Neutral
The current monthly candle shows a 'Shooting Star' structure with a very long upper wick (high of 115.72 vs close of 79.62), indicating significant profit-taking and rejection of higher prices despite the green close.
Long-term Sentiment (weeks to months): Bullish
The chart shows a massive structural breakout from a multi-year base near $10. Price remains well above the rising 20-month and 50-month SMAs, confirming a strong long-term uptrend regime.
Report Metadata
- Timeframe: monthly
- Generated at: 2026-02-02T06:55:18.282Z
- Model: gemini-3-pro-preview
Support Price Levels
| Level | Range | Strength | Notes |
|---|---|---|---|
| $48.14 | $48.00 - $48.27 | Strong | Aligns with the 20-month SMA (Bollinger Band basis), acting as the first major dynamic support. |
| $25.23 | $25.00 - $25.46 | Strong | Aligns with the 50-month SMA, representing the long-term trend floor. |
| $12.50 | $10.00 - $15.00 | Strong | Historical multi-year base/consolidation zone prior to the breakout. |
Resistance Price Levels
| Level | Range | Strength | Notes |
|---|---|---|---|
| $115.36 | $115.00 - $115.72 | Strong | The current month's high and all-time high, representing the point of recent rejection. |
| $120.32 | $120.00 - $120.63 | Weak | Upper Bollinger Band level, acting as a technical ceiling. |
Potential Chart Patterns in Formation
| Strength | Pattern | Signal | Target | Details |
|---|---|---|---|---|
| Strong | Parabolic Breakout | Bullish | N/A | Price has moved vertically from the $10 base to highs over $100 in a short period. |
| Weak | Shooting Star (Candlestick) | Bearish | N/A | The current monthly candle features a long upper shadow, signaling selling pressure at the highs. |
Frequently Asked Questions about OKLO
What is the current sentiment for OKLO?
The short-term sentiment for OKLO is currently Neutral because The current monthly candle shows a 'Shooting Star' structure with a very long upper wick (high of 115.72 vs close of 79.62), indicating significant profit-taking and rejection of higher prices despite the green close.. The long-term trend is classified as Bullish.
What are the key support levels for OKLO?
StockDips.AI has identified key support levels for OKLO at $48.14 and $25.23. These levels may represent potential accumulation zones where buying interest could emerge.
Is OKLO in a significant dip or a Value Dip right now?
OKLO has a Value Score of 84/100. It is currently flagged as a significant dip in the Top Dips list. It is also listed as a Value Dip because long-term sentiment is bullish.
View the full interactive analysis on StockDips.AI.