PFE Monthly Technical Analysis
Pfizer Inc.
Global pharmaceutical company specializing in vaccines, oncology, and infectious disease treatments. Known for major blockbuster drugs and vaccine platforms.
PFE Technical Analysis Summary
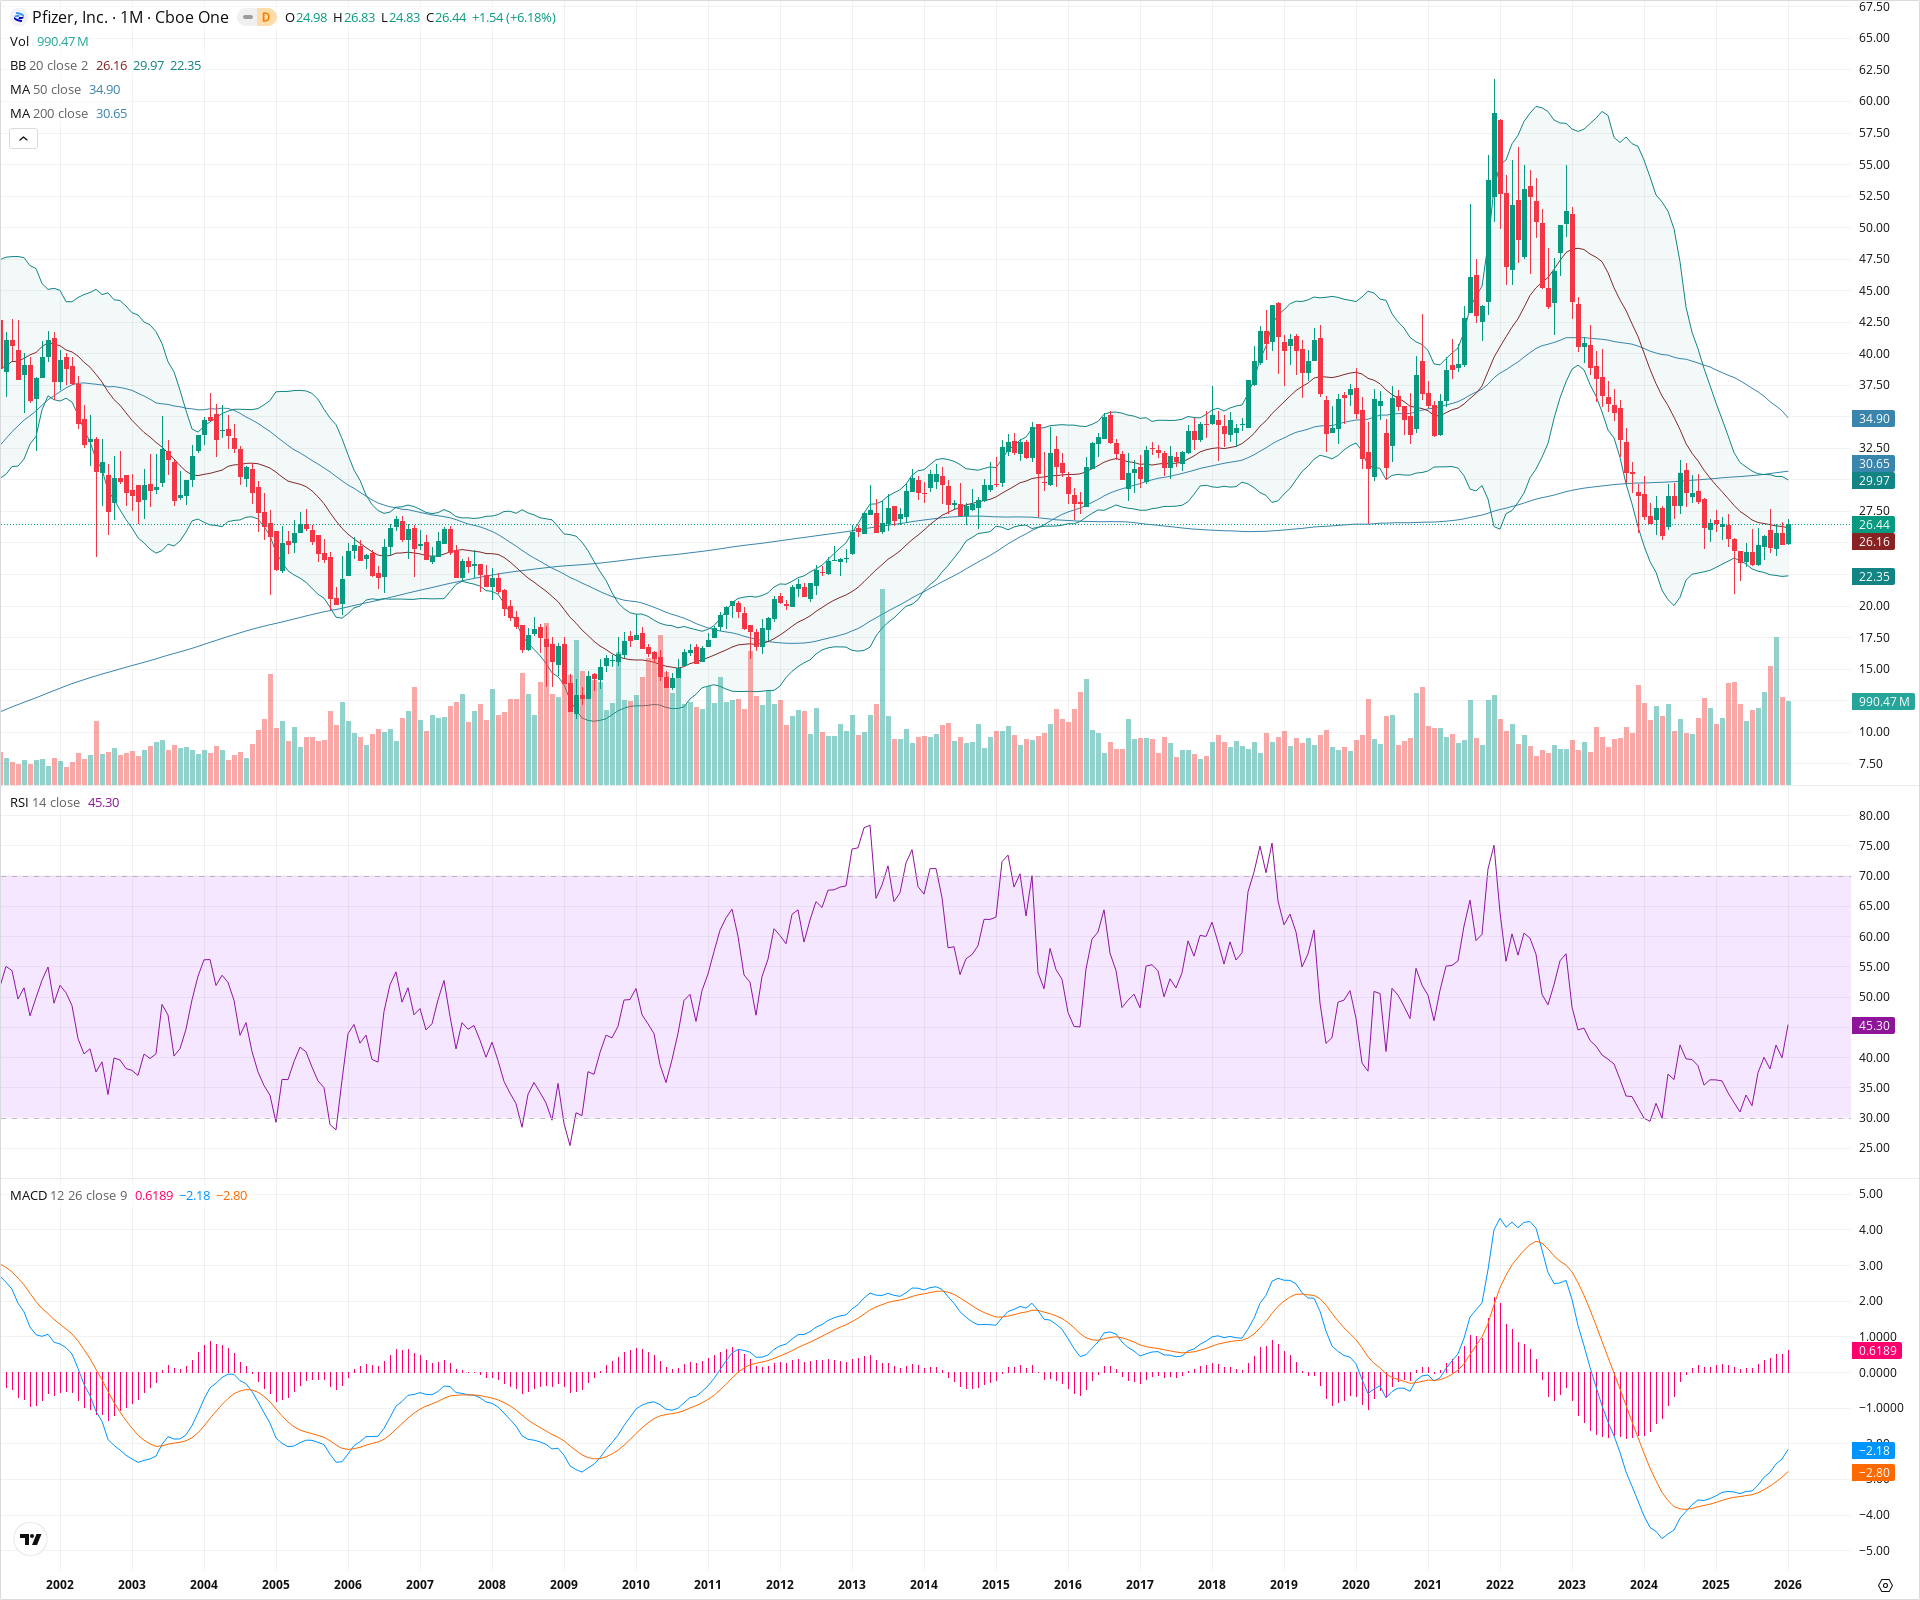
Pfizer is currently attempting to stabilize at a critical decade-long support level around $25 after a severe multi-year downtrend that broke the long-term 200-month SMA. While the short-term picture shows signs of a rebound driven by a monthly MACD crossover and oversold conditions, the long-term structure remains bearish as price trades well below key moving averages. Investors should watch for a reaction at the $30 resistance zone (200 MA) to determine if this is a genuine reversal or merely a technical bounce within a secular decline.
Included In Lists
Related Tickers of Interest
PFE Monthly Chart
Sentiment
Short-term Sentiment (days to weeks): Bullish
Price is rebounding strongly from major historical support with a bullish monthly candle; MACD has executed a bullish crossover indicating improving momentum.
Long-term Sentiment (weeks to months): Bearish
The stock remains in a multi-year downtrend, trading significantly below both the 50-month and 200-month Simple Moving Averages, confirming sustained structural weakness.
Report Metadata
- Timeframe: monthly
- Generated at: 2026-02-02T06:56:00.510Z
- Model: gemini-3-pro-preview
Support Price Levels
| Level | Range | Strength | Notes |
|---|---|---|---|
| $25.40 | $24.80 - $26.00 | Strong | Critical multi-year polarity zone; acted as resistance in 2013-2014 and support during the 2020 crash and recent 2024 lows. |
| $18.25 | $17.50 - $19.00 | Strong | Major historical consolidation zone from the 2011-2012 period. |
Resistance Price Levels
| Level | Range | Strength | Notes |
|---|---|---|---|
| $30.31 | $29.97 - $30.65 | Strong | Confluence of the 20-month SMA (Bollinger basis) and the critical 200-month SMA. |
| $35.45 | $34.90 - $36.00 | Strong | 50-month SMA and a significant breakdown level from 2023. |
| $43.00 | $42.00 - $44.00 | Weak | Prior swing low and structural resistance zone. |
Potential Chart Patterns in Formation
| Strength | Pattern | Signal | Target | Details |
|---|---|---|---|---|
| Weak | Potential Double Bottom | Bullish | $30.65 | Price has tested the $25 support level twice in recent months and is attempting to base, suggesting a potential floor. |
| Strong | Secular Downtrend | Bearish | N/A | A clear series of lower highs and lower lows from the 2021 peak, breaking major moving average supports. |
Frequently Asked Questions about PFE
What is the current sentiment for PFE?
The short-term sentiment for PFE is currently Bullish because Price is rebounding strongly from major historical support with a bullish monthly candle; MACD has executed a bullish crossover indicating improving momentum.. The long-term trend is classified as Bearish.
What are the key support levels for PFE?
StockDips.AI has identified key support levels for PFE at $25.40 and $18.25. These levels may represent potential accumulation zones where buying interest could emerge.
Is PFE in a significant dip or a Value Dip right now?
PFE has a Value Score of 66/100. It is not currently flagged as a significant dip in the Top Dips list. It is not listed as a Value Dip because the long-term sentiment or value-score threshold does not qualify.
View the full interactive analysis on StockDips.AI.