PLTR Monthly Technical Analysis
Palantir Technologies Inc
Builds data analytics and AI software for governments and enterprises.
PLTR Technical Analysis Summary
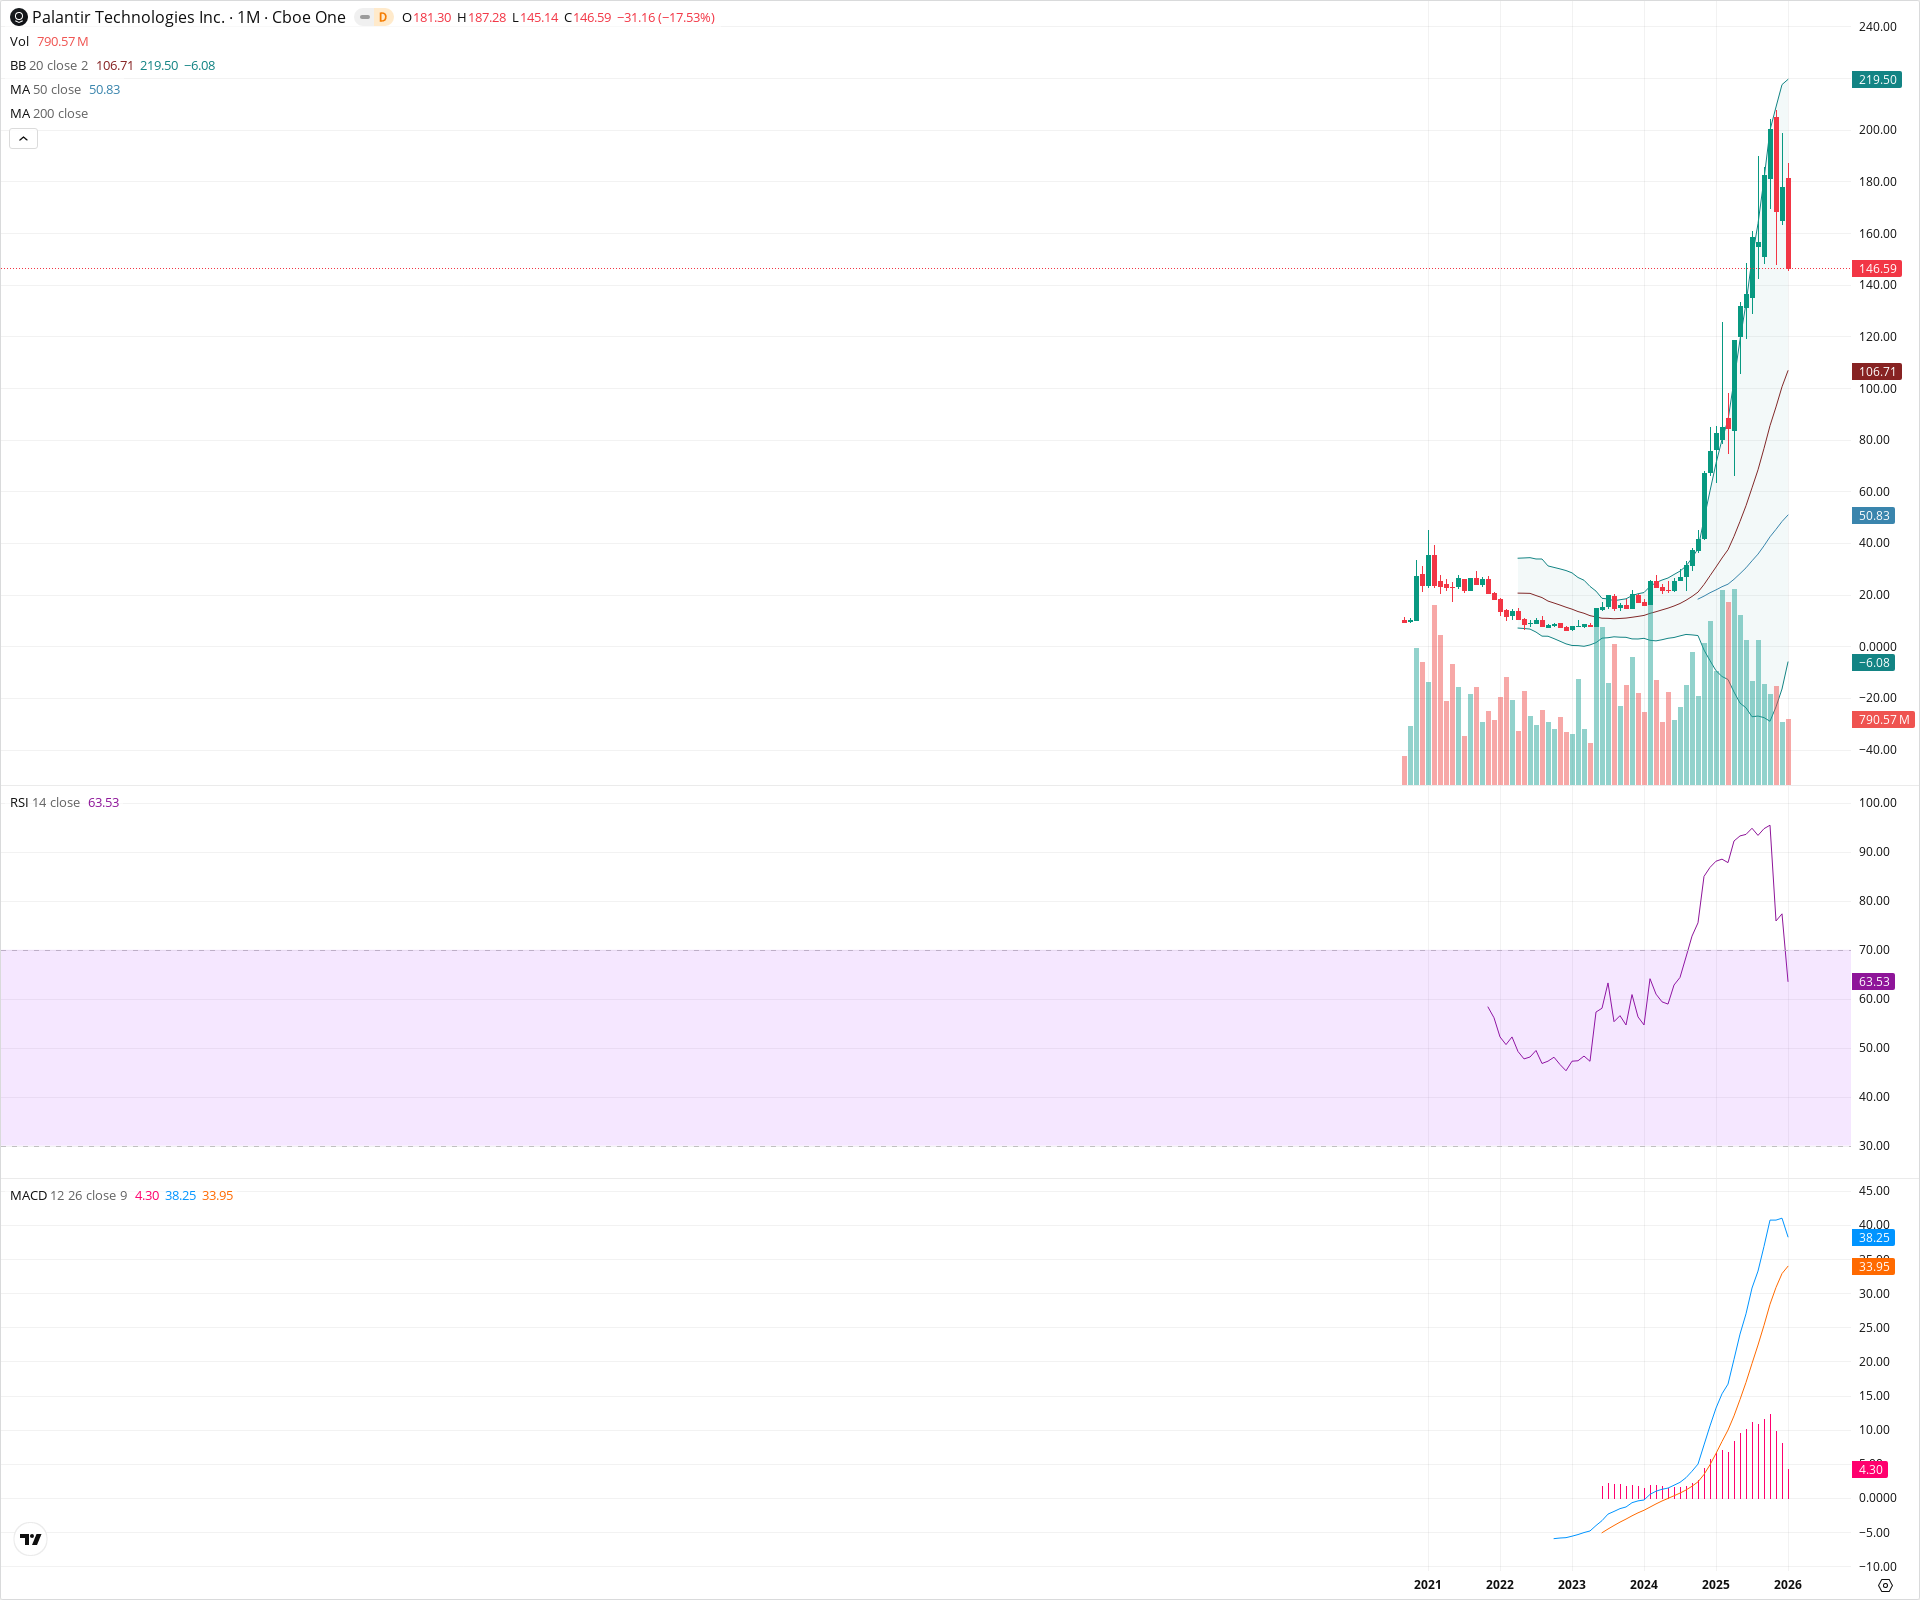
PLTR has executed a massive parabolic breakout from a long-term base, establishing a strong secular bull regime confirmed by rising major moving averages and MACD. However, the current month reveals significant selling pressure with a 17% drop from all-time highs, suggesting the stock is entering a consolidation or mean-reversion phase to digest recent gains. While the long-term structure remains constructive, investors should anticipate volatility as price seeks equilibrium near the 20-month SMA.
Included In Lists
Related Tickers of Interest
PLTR Monthly Chart
Sentiment
Short-term Sentiment (days to weeks): Bearish
The current monthly candle is a large bearish engulfing-style bar showing a ~17% decline from highs, indicating a sharp rejection and immediate profit-taking after a parabolic run.
Long-term Sentiment (weeks to months): Bullish
The stock remains in a powerful secular uptrend, trading well above the rising 20-month (approx. 106) and 50-month (approx. 50) SMAs, with the MACD line holding high above the zero line.
Report Metadata
- Timeframe: monthly
- Generated at: 2026-02-02T06:56:25.252Z
- Model: gemini-3-pro-preview
Support Price Levels
| Level | Range | Strength | Notes |
|---|---|---|---|
| $103.35 | $100.00 - $106.71 | Strong | Confluence of the psychological $100 level and the rising 20-month SMA (Bollinger Band basis), which serves as the primary mean-reversion target. |
| $55.00 | $50.00 - $60.00 | Strong | Major structural support zone containing the 50-month SMA and previous consolidation areas before the vertical ascent. |
Resistance Price Levels
| Level | Range | Strength | Notes |
|---|---|---|---|
| $184.29 | $181.30 - $187.28 | Strong | The current month's open and the all-time high form a formidable resistance zone. |
| $219.75 | $219.50 - $220.00 | Weak | The upper Bollinger Band level, serving as a theoretical dynamic resistance ceiling. |
Potential Chart Patterns in Formation
| Strength | Pattern | Signal | Target | Details |
|---|---|---|---|---|
| Strong | Parabolic Breakout | Bullish | N/A | After a multi-year base (2021-2023), price entered a vertical discovery phase. The current pullback suggests the climax of this specific impulse leg. |
Frequently Asked Questions about PLTR
What is the current sentiment for PLTR?
The short-term sentiment for PLTR is currently Bearish because The current monthly candle is a large bearish engulfing-style bar showing a ~17% decline from highs, indicating a sharp rejection and immediate profit-taking after a parabolic run.. The long-term trend is classified as Bullish.
What are the key support levels for PLTR?
StockDips.AI has identified key support levels for PLTR at $103.35 and $55.00. These levels may represent potential accumulation zones where buying interest could emerge.
Is PLTR in a significant dip or a Value Dip right now?
PLTR has a Value Score of 37/100. It is not currently flagged as a significant dip in the Top Dips list. It is not listed as a Value Dip because the long-term sentiment or value-score threshold does not qualify.
View the full interactive analysis on StockDips.AI.