SLV Monthly Technical Analysis
iShares Silver Trust
Tracks the price of physical silver bullion. Silver has both monetary and industrial uses, making it more volatile than gold. It is commonly viewed as a leveraged play on precious metals with sensitivity to economic growth, inflation, and speculative cycles.
SLV Technical Analysis Summary
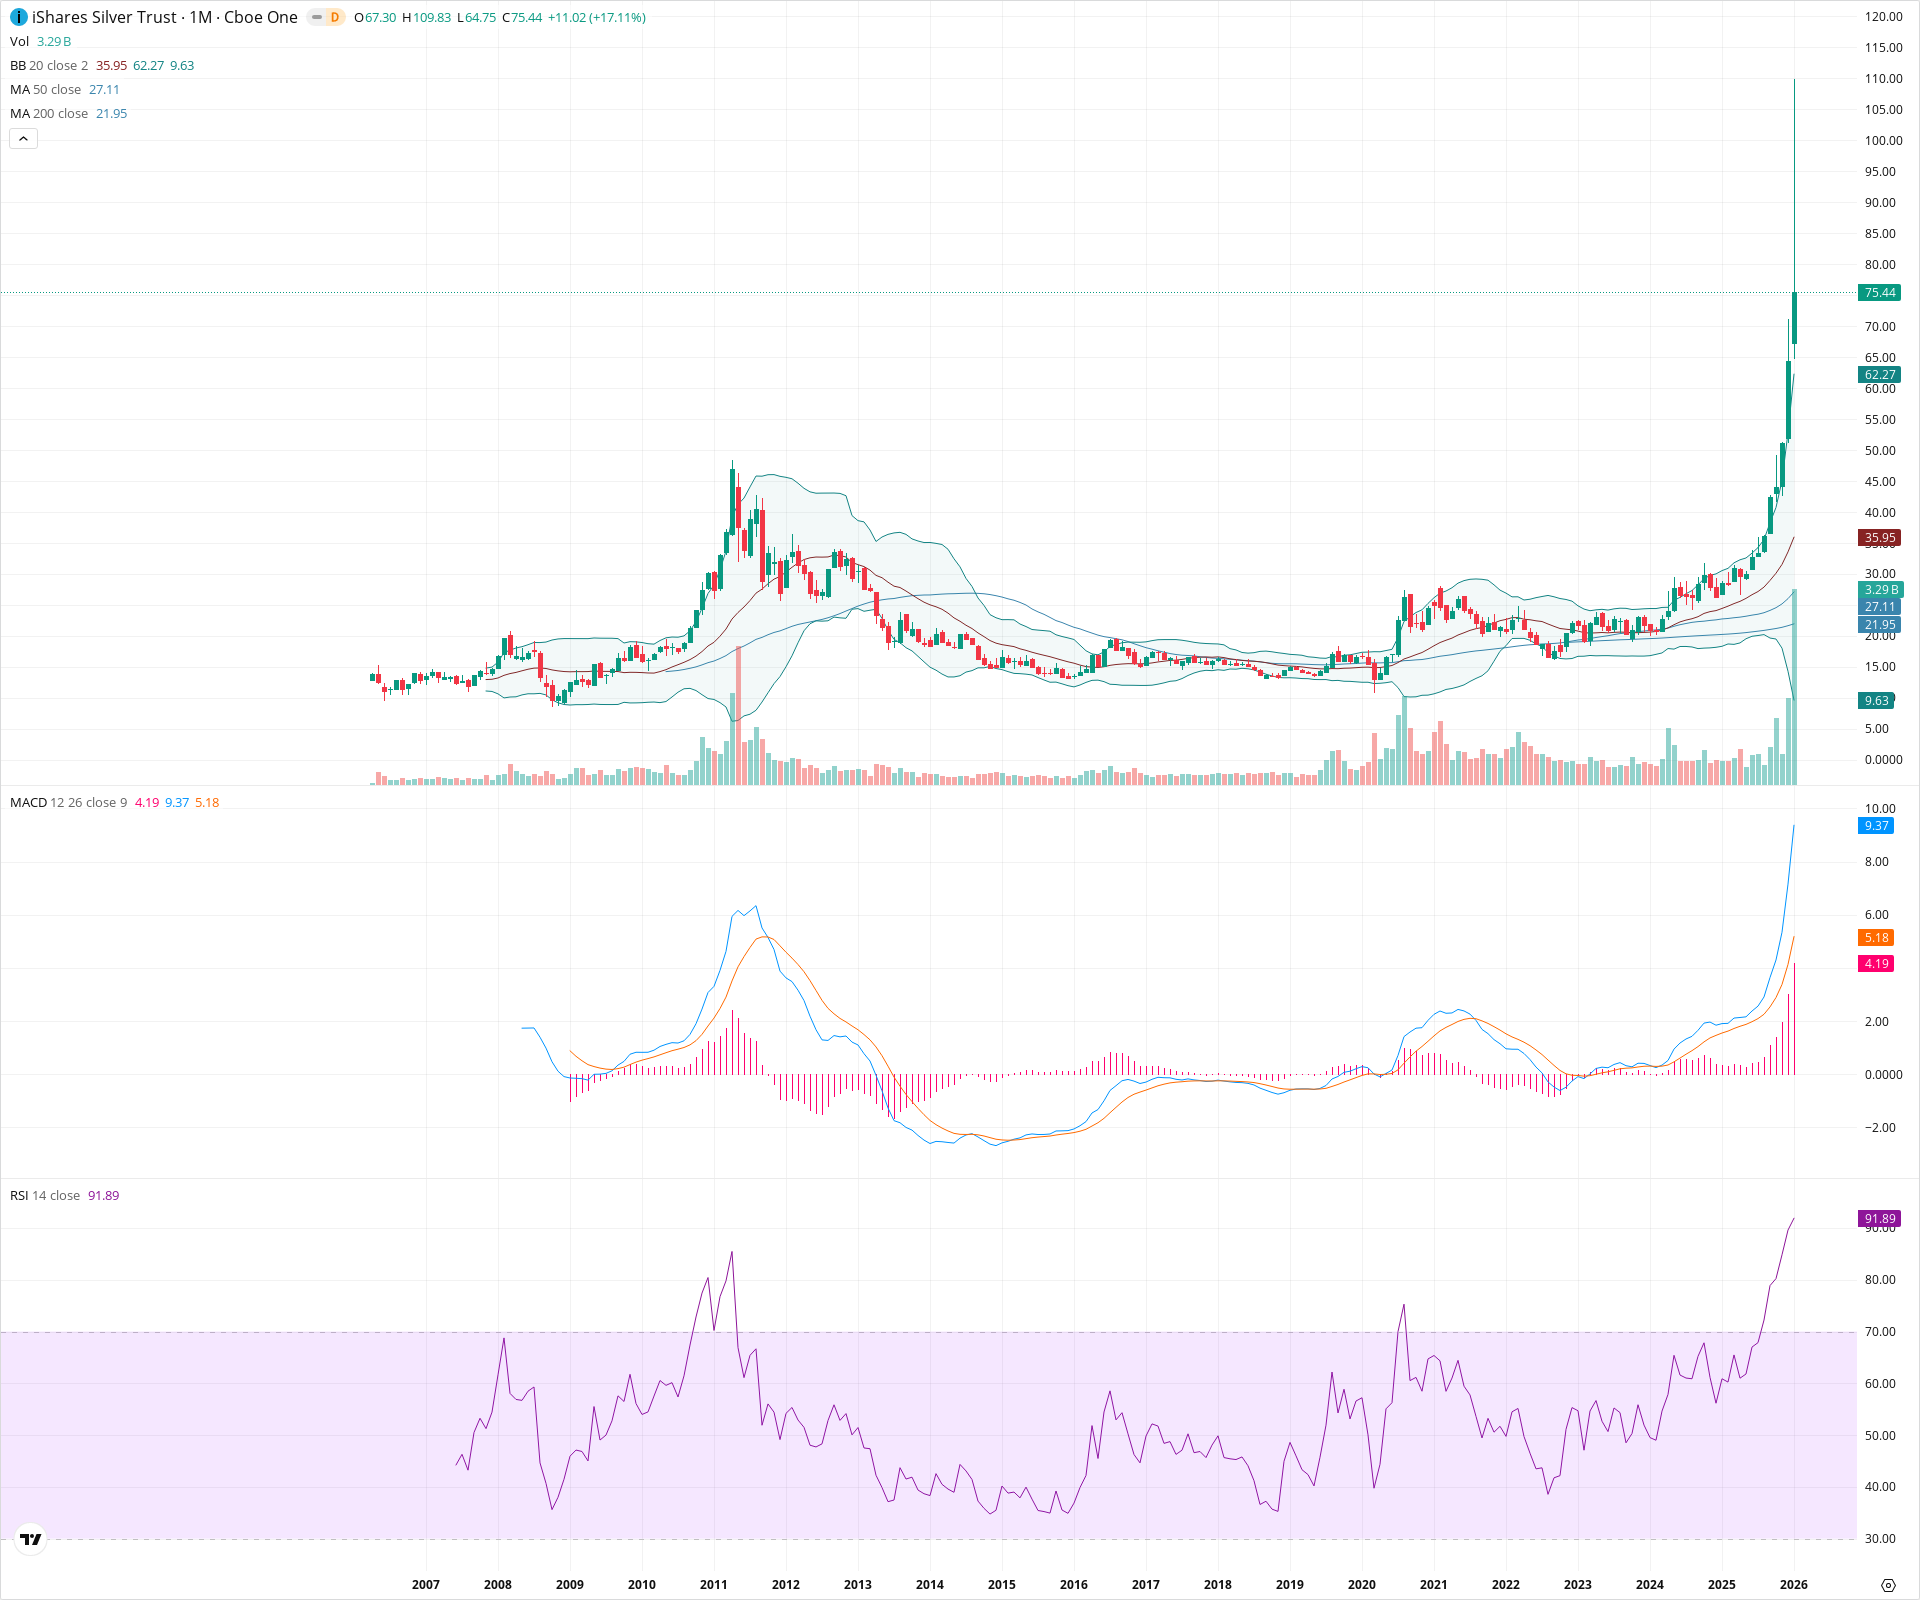
SLV has executed a historic technical breakout, shattering the 2011 resistance levels around 50.00 to enter a parabolic price discovery mode. Indicators are at extreme levels (RSI > 90, price double the upper Bollinger Band), suggesting a powerful secular trend change driven by immense momentum, though such vertical extensions often invite high volatility.
Included In Lists
Related Tickers of Interest
SLV Monthly Chart
Sentiment
Short-term Sentiment (days to weeks): Bullish
Price is exhibiting extreme vertical momentum, trading far above the upper Bollinger Band with an RSI of 91, indicating a powerful breakout phase.
Long-term Sentiment (weeks to months): Bullish
The asset has decisively broken out of a 13-year structural base and cleared the 2011 all-time highs, signaling a new secular bull regime.
Report Metadata
- Timeframe: monthly
- Generated at: 2026-02-02T07:17:32.118Z
- Model: gemini-3-pro-preview
Support Price Levels
| Level | Range | Strength | Notes |
|---|---|---|---|
| $49.00 | $48.00 - $50.00 | Strong | Former major cycle high from 2011, now a critical structural support level following the breakout. |
| $29.00 | $28.00 - $30.00 | Strong | Top of the multi-year consolidation zone that served as the launchpad for the current move. |
| $26.50 | $26.00 - $27.00 | Weak | Aligns with the 50-month SMA, providing long-term mean reversion support. |
Resistance Price Levels
| Level | Range | Strength | Notes |
|---|---|---|---|
| $109.50 | $109.00 - $110.00 | Strong | The current month's high represents the immediate ceiling in this price discovery phase. |
Potential Chart Patterns in Formation
| Strength | Pattern | Signal | Target | Details |
|---|---|---|---|---|
| Strong | Massive Multi-Year Base / Cup and Handle | Bullish | N/A | A decade-long saucer formation (2011–2020) followed by a consolidation handle (2020–2024), culminating in a violent breakout. |
Frequently Asked Questions about SLV
What is the current sentiment for SLV?
The short-term sentiment for SLV is currently Bullish because Price is exhibiting extreme vertical momentum, trading far above the upper Bollinger Band with an RSI of 91, indicating a powerful breakout phase.. The long-term trend is classified as Bullish.
What are the key support levels for SLV?
StockDips.AI has identified key support levels for SLV at $49.00 and $29.00. These levels may represent potential accumulation zones where buying interest could emerge.
Is SLV in a significant dip or a Value Dip right now?
SLV has a Value Score of 28/100. It is not currently flagged as a significant dip in the Top Dips list. It is not listed as a Value Dip because the long-term sentiment or value-score threshold does not qualify.
View the full interactive analysis on StockDips.AI.