SMR Monthly Technical Analysis
NuScale Power Corporation
Develops small modular nuclear reactors (SMRs) aimed at scalable, low-carbon nuclear power generation.
SMR Technical Analysis Summary
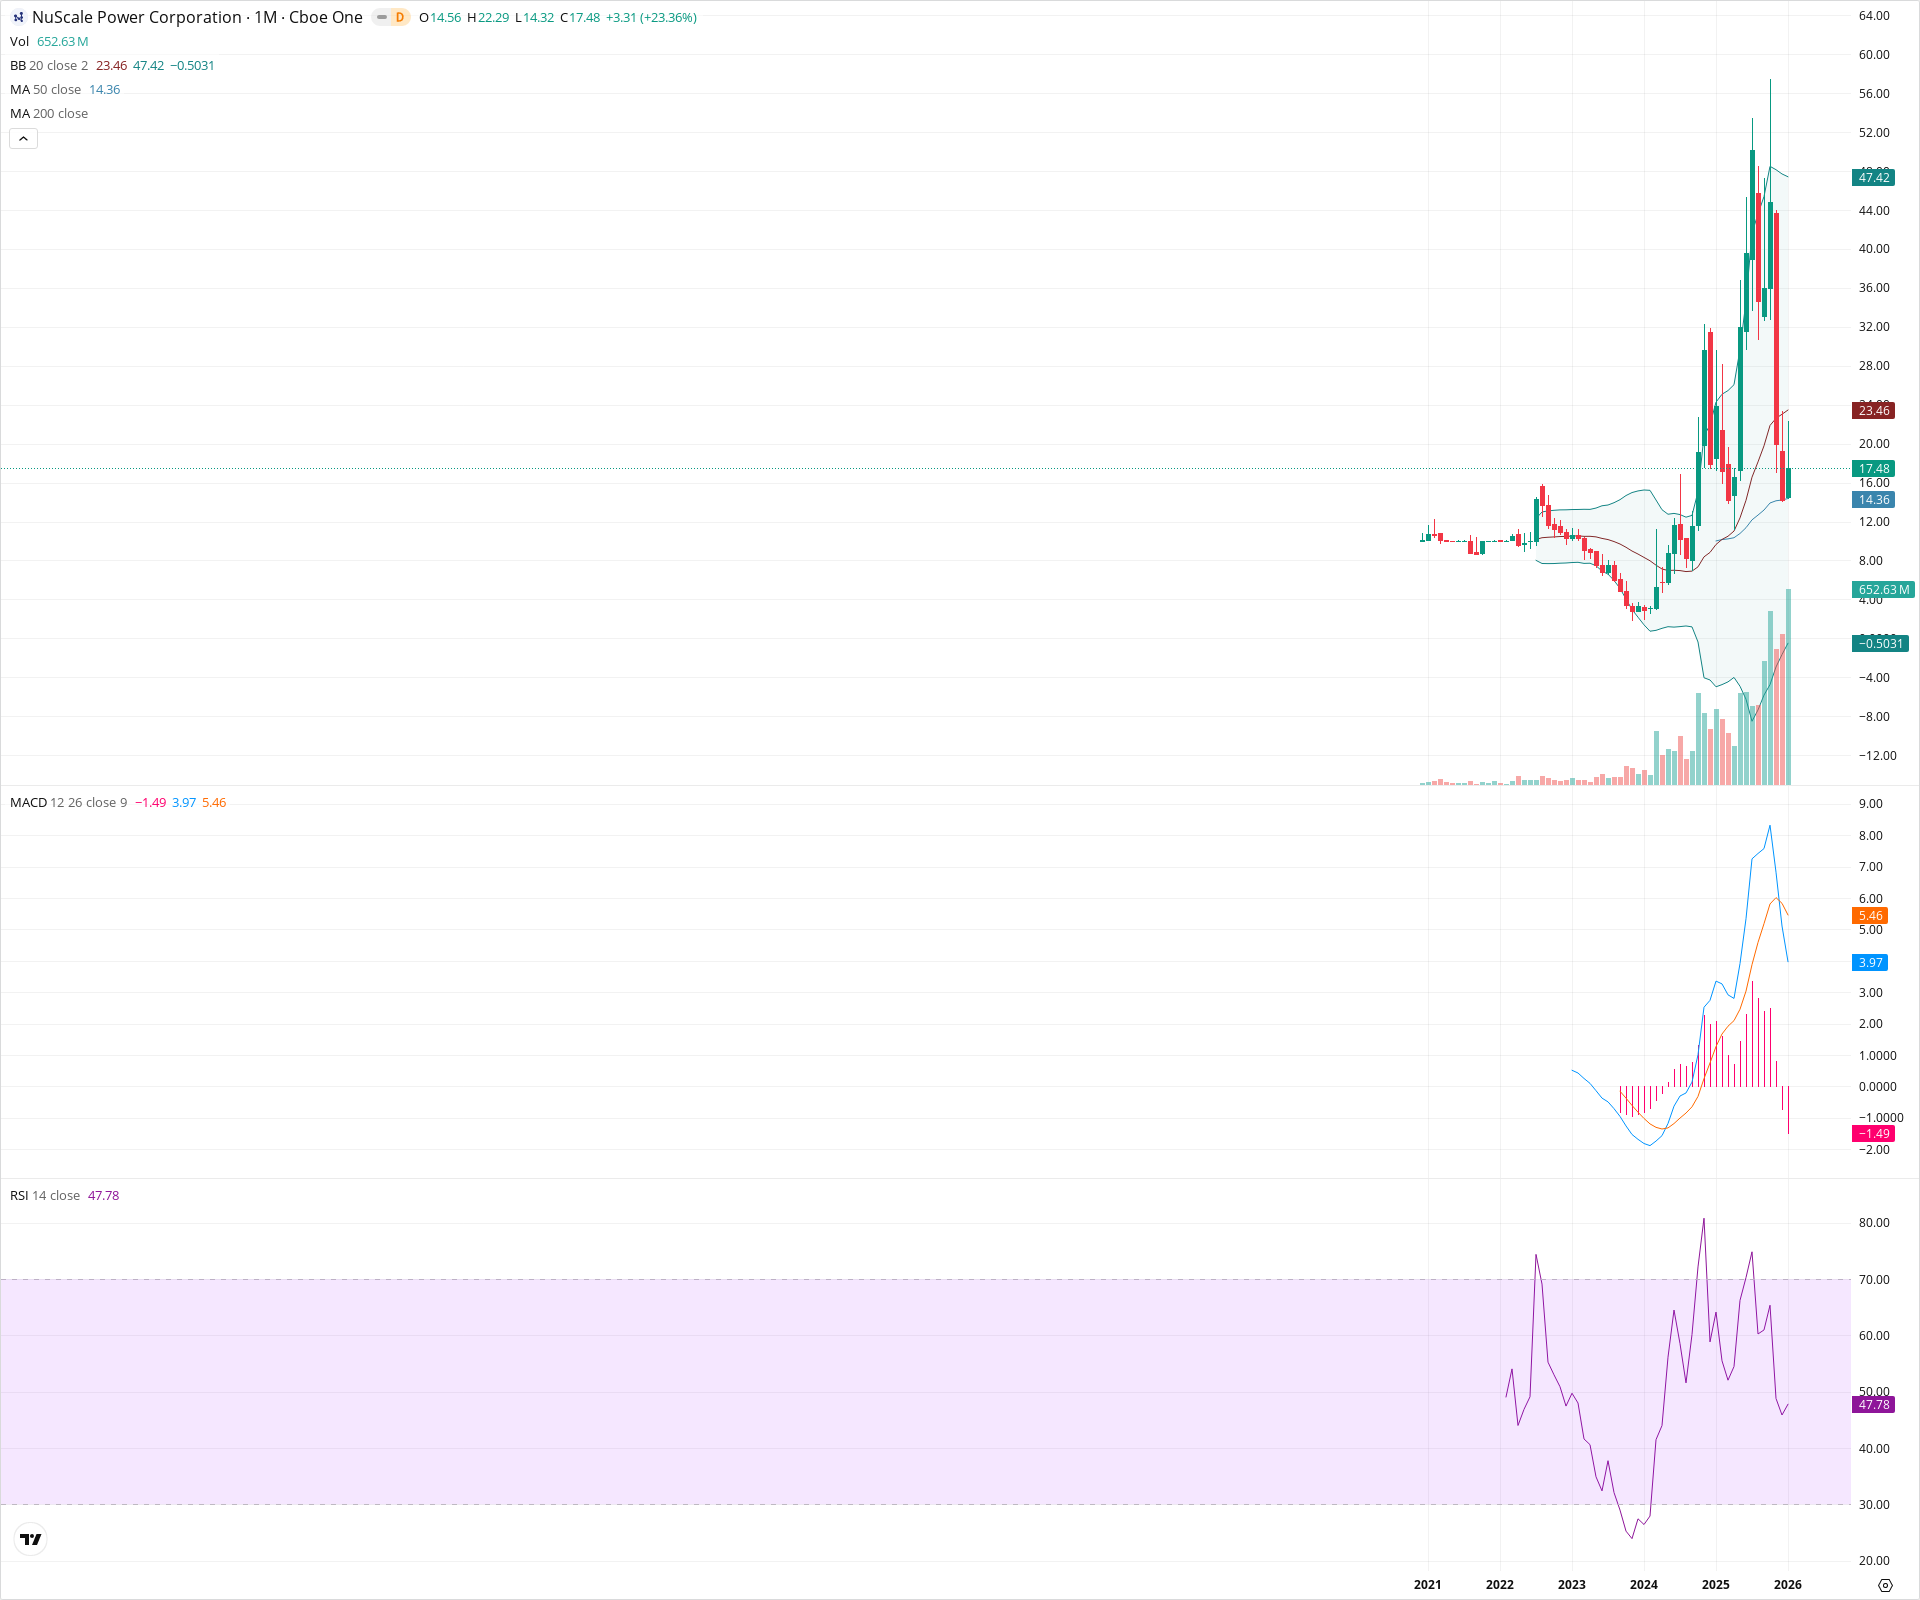
NuScale Power Corporation (SMR) is currently undergoing a volatile consolidation phase following a massive parabolic run-up and subsequent correction. The stock has found critical technical support at the 50-month SMA (~14.36), which preserves the long-term bullish structure despite bearish momentum indicators like the MACD crossover. Investors should watch for a stabilization base to form between 14.00 and 23.00 before a new sustained trend emerges.
Included In Lists
Related Tickers of Interest
SMR Monthly Chart
Sentiment
Short-term Sentiment (days to weeks): Neutral
The stock is attempting to stabilize with a +23% bounce after a severe correction from recent highs near 50.00. While holding the 50 SMA is positive, the price remains below the 20 SMA and MACD momentum is clearly negative.
Long-term Sentiment (weeks to months): Bullish
Despite the sharp recent drawdown, the stock remains in a secular uptrend, trading well above its multi-year base ($2-$4) and holding major structural support at the 50-period SMA.
Report Metadata
- Timeframe: monthly
- Generated at: 2026-02-02T06:57:14.911Z
- Model: gemini-3-pro-preview
Support Price Levels
| Level | Range | Strength | Notes |
|---|---|---|---|
| $14.35 | $14.30 - $14.40 | Strong | Confluence of the current monthly low and the 50-period SMA (14.36). |
| $9.00 | $8.00 - $10.00 | Strong | Previous breakout consolidation zone prior to the parabolic rally. |
Resistance Price Levels
| Level | Range | Strength | Notes |
|---|---|---|---|
| $22.90 | $22.30 - $23.50 | Strong | Current monthly high combined with the overhead 20-period SMA (23.46). |
| $50.00 | $48.00 - $52.00 | Strong | Major swing high / blow-off top peak established in mid-2024. |
Potential Chart Patterns in Formation
| Strength | Pattern | Signal | Target | Details |
|---|---|---|---|---|
| Strong | Blow-off Top Correction | Neutral | N/A | A parabolic vertical rise to ~50.00 followed by a sharp mean reversion. The price has retraced significantly to test the longer-term moving average trend. |
Frequently Asked Questions about SMR
What is the current sentiment for SMR?
The short-term sentiment for SMR is currently Neutral because The stock is attempting to stabilize with a +23% bounce after a severe correction from recent highs near 50.00. While holding the 50 SMA is positive, the price remains below the 20 SMA and MACD momentum is clearly negative.. The long-term trend is classified as Bullish.
What are the key support levels for SMR?
StockDips.AI has identified key support levels for SMR at $14.35 and $9.00. These levels may represent potential accumulation zones where buying interest could emerge.
Is SMR in a significant dip or a Value Dip right now?
SMR has a Value Score of 74/100. It is currently flagged as a significant dip in the Top Dips list. It is also listed as a Value Dip because long-term sentiment is bullish.
View the full interactive analysis on StockDips.AI.