UEC Weekly Technical Analysis
Uranium Energy Corp
Uranium mining and exploration company positioned to benefit from rising nuclear fuel demand.
UEC Technical Analysis Summary
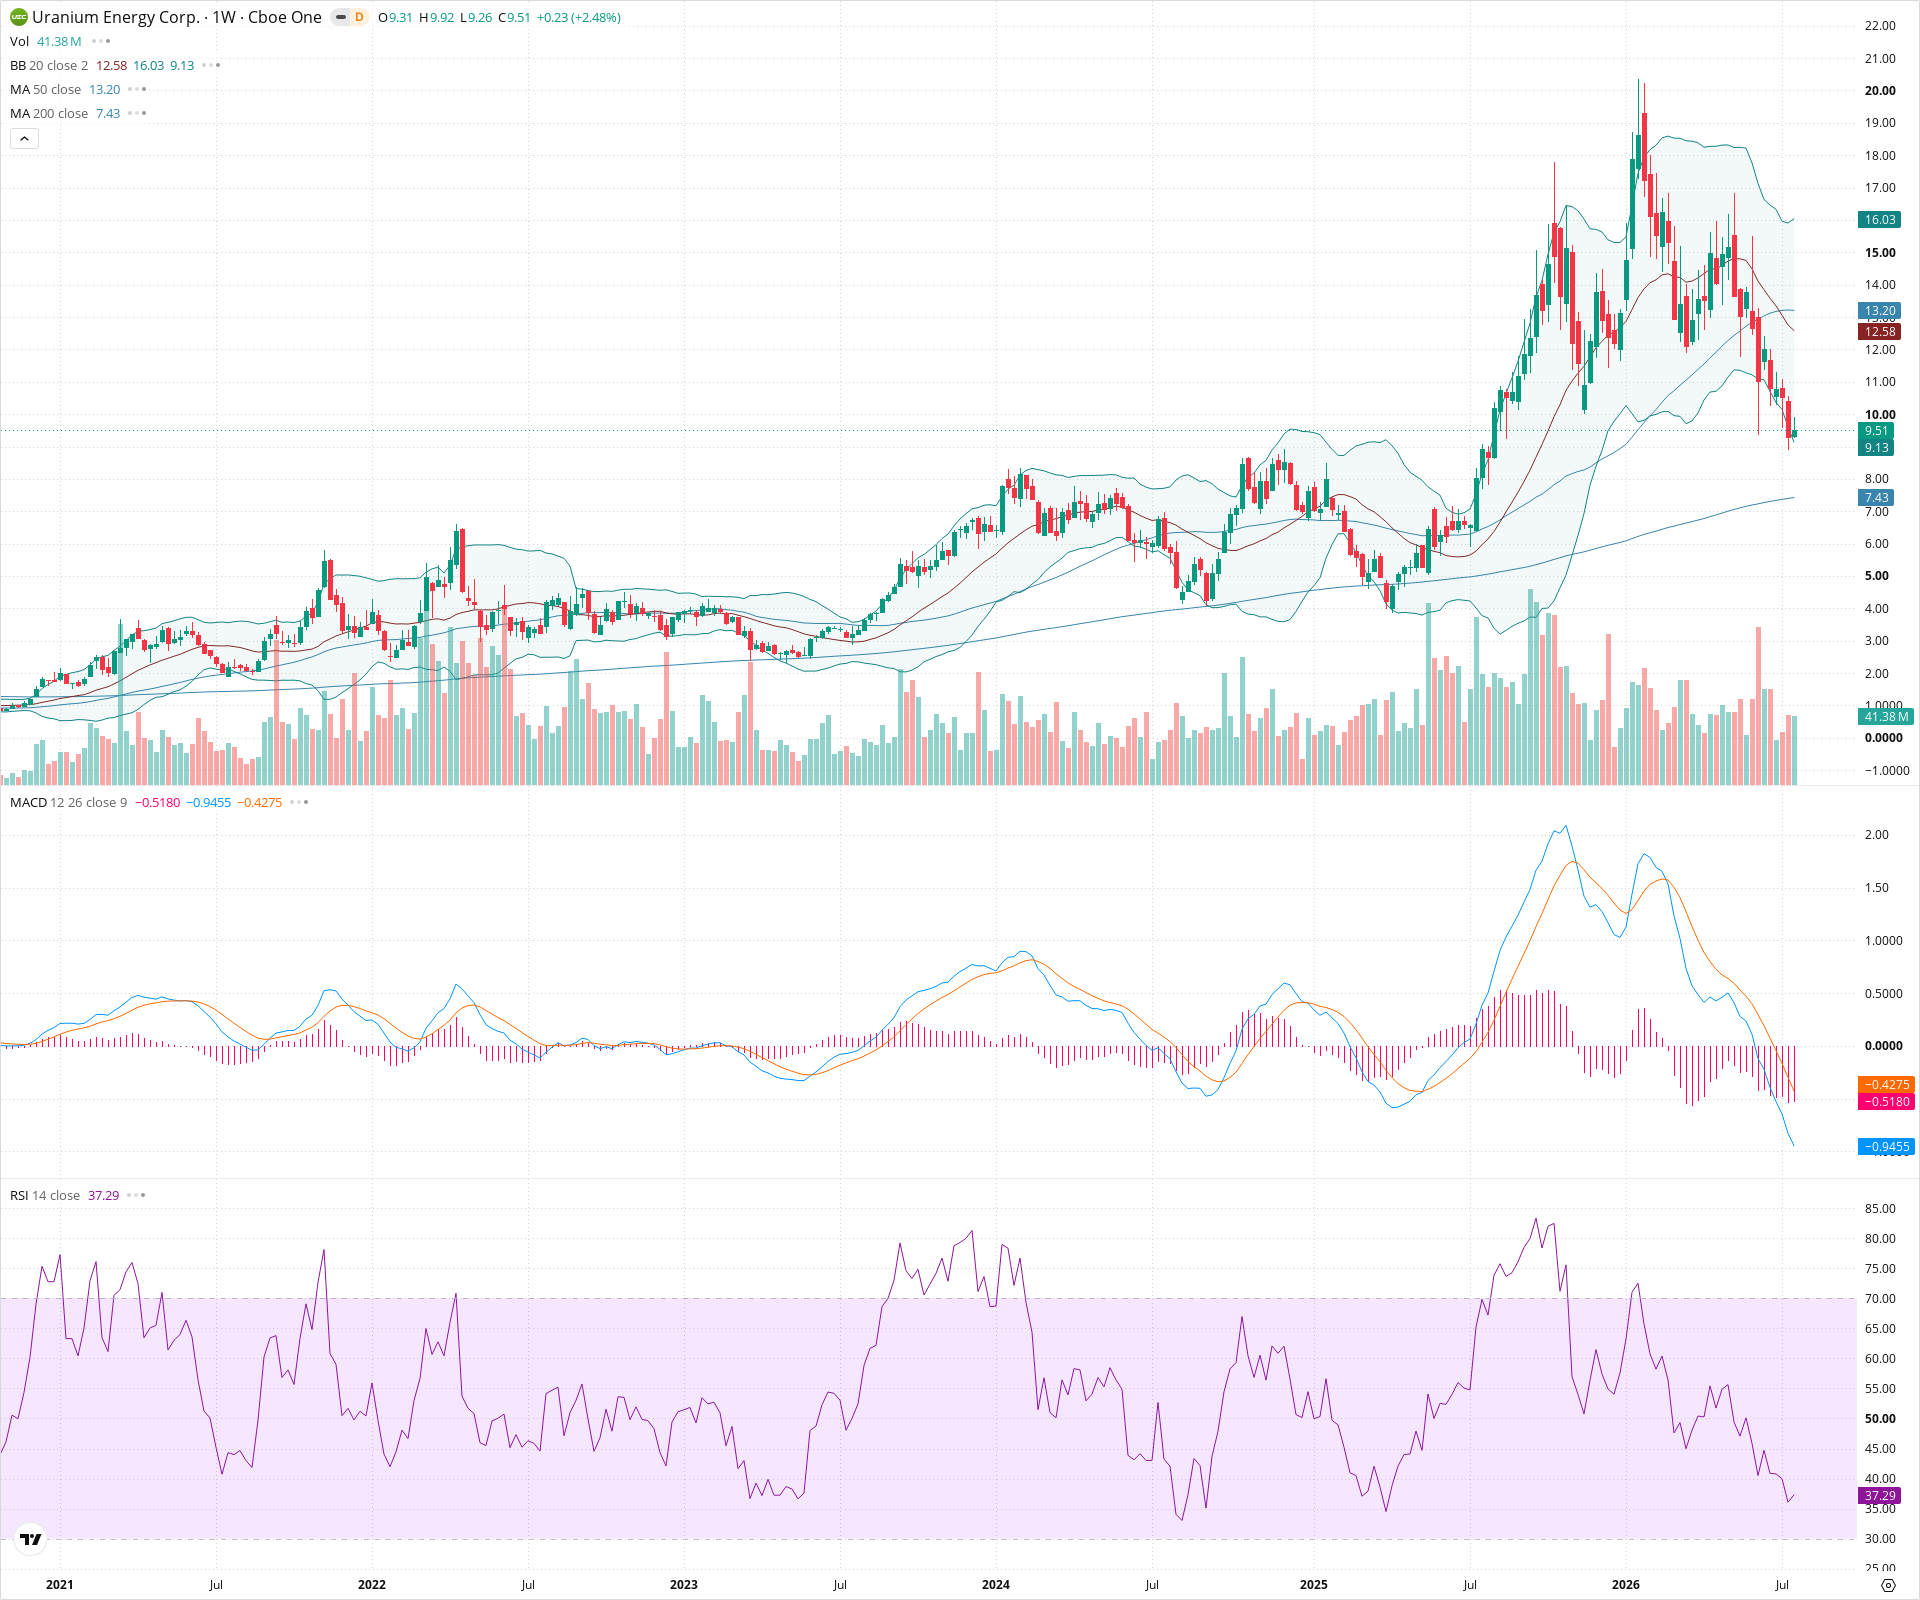
UEC has suffered a severe technical breakdown following a parabolic advance, completing a massive multi-month topping pattern. The price has plummeted through major support levels and its 50-week SMA, accompanied by deeply negative momentum on the MACD. For long-term investors, the critical area to monitor is the $7.00-$8.00 zone, where the rising 200-week SMA sits; holding this level is essential to prevent further structural damage to the long-term uptrend.
Included In Lists
Related Tickers of Interest
UEC Weekly Chart
Sentiment
Short-term Sentiment (days to weeks): Bearish
Price is in a steep, accelerated downtrend, falling well below the 20-week and 50-week SMAs. The MACD histogram is expanding negatively, and RSI is dropping sharply towards oversold territory, indicating strong selling pressure.
Long-term Sentiment (weeks to months): Neutral
Despite the severe medium-term breakdown and formation of a major top, the price currently remains above the rising 200-week SMA, which keeps the longest-term secular uptrend technically intact, albeit under extreme stress.
Report Metadata
- Timeframe: weekly
- Generated at: 2026-07-25T09:10:53.101Z
- Model: gemini-3.1-pro-preview
Support Price Levels
| Level | Range | Strength | Notes |
|---|---|---|---|
| $7.50 | $7.00 - $8.00 | Strong | Critical support zone featuring confluence of the rising 200-week SMA (currently at 7.43) and a significant prior consolidation base from mid-to-late 2023. |
| $5.00 | $4.00 - $6.00 | Strong | Major historical, multi-year consolidation area that served as both resistance and support between 2021 and 2023. |
Resistance Price Levels
| Level | Range | Strength | Notes |
|---|---|---|---|
| $13.00 | $12.00 - $14.00 | Strong | Former major support level (neckline of topping pattern) that is expected to act as strong resistance on bounces, reinforced by the declining 50-week SMA and middle Bollinger Band. |
| $21.00 | $20.00 - $22.00 | Strong | The absolute multi-year swing high and climax peak area. |
Potential Chart Patterns in Formation
| Strength | Pattern | Signal | Target | Details |
|---|---|---|---|---|
| Strong | Head and Shoulders Top | Bearish | N/A | A massive, multi-month topping pattern clearly visible with a left shoulder around $18, a head near $22, and a right shoulder near $16. The pattern was confirmed by a decisive high-volume breakdown below the neckline support around $14-$15. |
Frequently Asked Questions about UEC
What is the current sentiment for UEC?
The short-term sentiment for UEC is currently Bearish because Price is in a steep, accelerated downtrend, falling well below the 20-week and 50-week SMAs. The MACD histogram is expanding negatively, and RSI is dropping sharply towards oversold territory, indicating strong selling pressure.. The long-term trend is classified as Neutral.
What are the key support levels for UEC?
StockDips.AI has identified key support levels for UEC at $7.50 and $5.00. These levels may represent potential accumulation zones where buying interest could emerge.
Is UEC in a significant dip or a Value Dip right now?
UEC has a Value Score of 59/100. It is not currently flagged as a significant dip in the Top Dips list. It is not listed as a Value Dip because the long-term sentiment or value-score threshold does not qualify.
View the full interactive analysis on StockDips.AI.