UEC Monthly Technical Analysis
Uranium Energy Corp
Uranium mining and exploration company positioned to benefit from rising nuclear fuel demand.
UEC Technical Analysis Summary
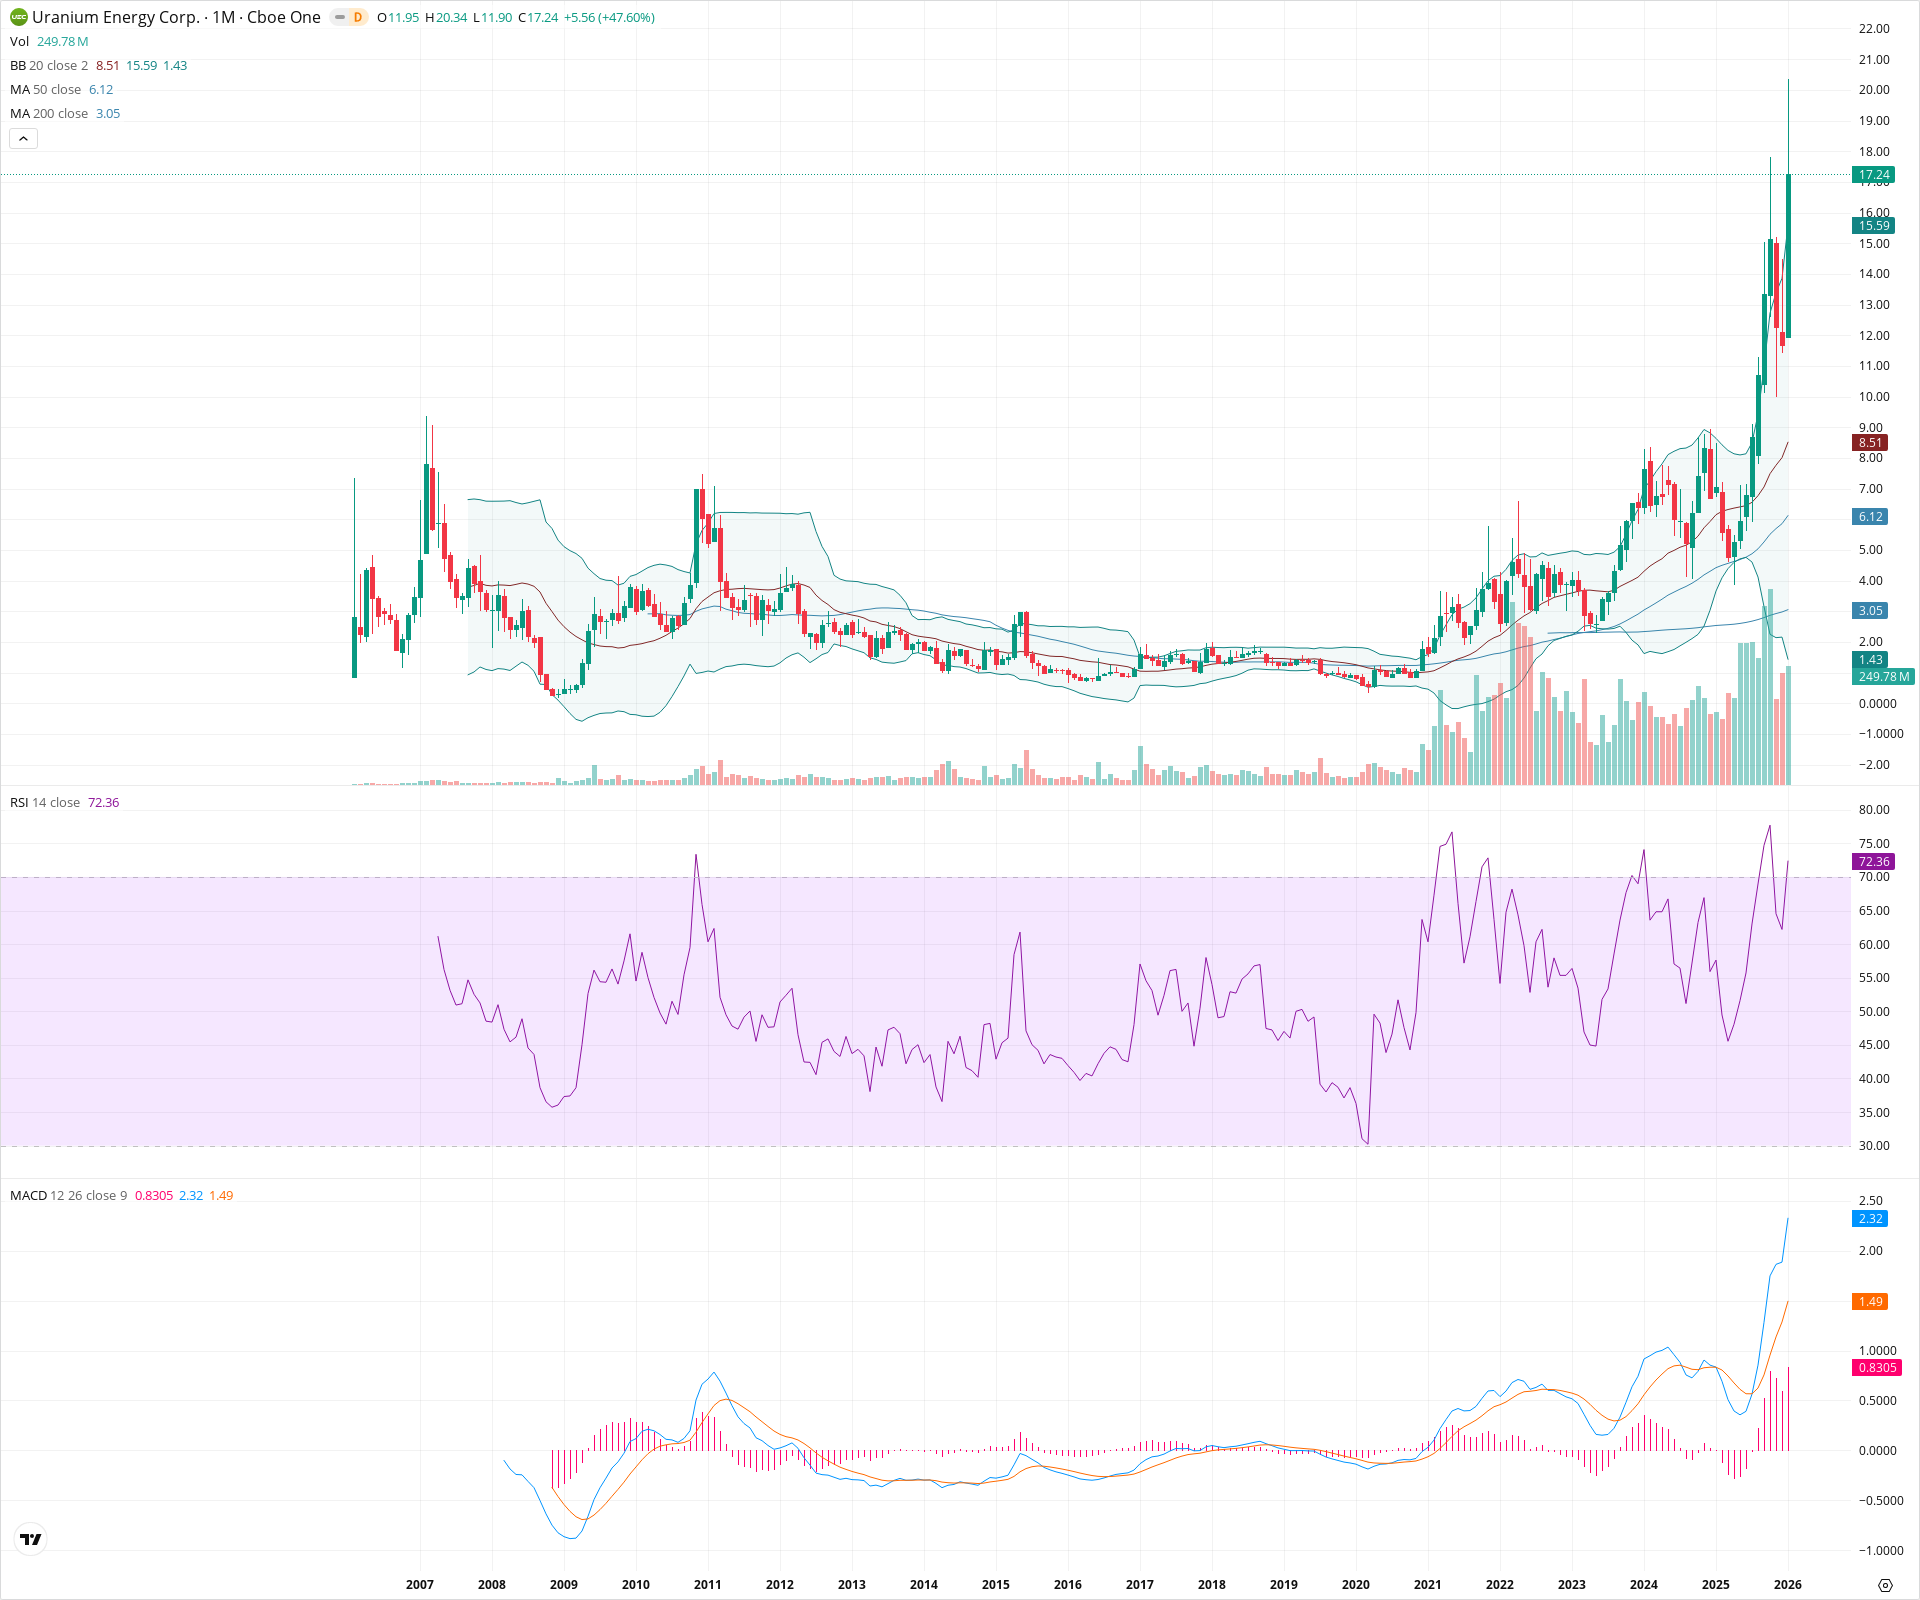
UEC has confirmed a major secular breakout from a decade-long base, clearing key resistance at the $8.50 level with expanding volume and momentum. The price action is currently parabolic, trading well above the upper Bollinger Band, which suggests extreme strength but raises the probability of volatility or consolidation near the $20 mark. Long-term trend indicators like the MACD and moving averages are firmly bullish, supporting a sustained uptrend, though the distance from the 20-month SMA indicates extended conditions.
Included In Lists
Related Tickers of Interest
UEC Monthly Chart
Sentiment
Short-term Sentiment (days to weeks): Bullish
Price is in a vertical parabolic breakout, trading significantly above the upper Bollinger Band with the current candle gaining over 47%. RSI is in bullish territory (>70), indicating strong momentum.
Long-term Sentiment (weeks to months): Bullish
The stock has decisively broken out of a multi-year structural base (2013-2023). Moving averages (20, 50, 200) are in bullish alignment and trending upwards, confirming a secular trend change.
Report Metadata
- Timeframe: monthly
- Generated at: 2026-02-02T06:59:18.530Z
- Model: gemini-3-pro-preview
Support Price Levels
| Level | Range | Strength | Notes |
|---|---|---|---|
| $11.75 | $11.50 - $12.00 | Weak | Previous month's closing level and current month's open; immediate short-term floor. |
| $8.25 | $8.00 - $8.51 | Strong | Major secular breakout zone coinciding with the 20-month SMA and prior multi-year resistance peaks. |
| $6.25 | $6.00 - $6.50 | Strong | Historical resistance turned support (2011 and 2021 highs) aligned with the 50-month SMA. |
Resistance Price Levels
| Level | Range | Strength | Notes |
|---|---|---|---|
| $20.17 | $20.00 - $20.34 | Strong | Current month's intraday high and psychological round number resistance. |
Potential Chart Patterns in Formation
| Strength | Pattern | Signal | Target | Details |
|---|---|---|---|---|
| Strong | Multi-Year Saucer Base Breakout | Bullish | N/A | A decade-long rounding bottom formation ending with a violent breakout above the $8.50 neckline. |
Frequently Asked Questions about UEC
What is the current sentiment for UEC?
The short-term sentiment for UEC is currently Bullish because Price is in a vertical parabolic breakout, trading significantly above the upper Bollinger Band with the current candle gaining over 47%. RSI is in bullish territory (>70), indicating strong momentum.. The long-term trend is classified as Bullish.
What are the key support levels for UEC?
StockDips.AI has identified key support levels for UEC at $11.75 and $8.25. These levels may represent potential accumulation zones where buying interest could emerge.
Is UEC in a significant dip or a Value Dip right now?
UEC has a Value Score of 59/100. It is not currently flagged as a significant dip in the Top Dips list. It is not listed as a Value Dip because the long-term sentiment or value-score threshold does not qualify.
View the full interactive analysis on StockDips.AI.