UNG Monthly Technical Analysis
United States Natural Gas Fund
Tracks the price of natural gas futures contracts. Natural gas is used for electricity generation, heating, and industrial production. Prices are highly volatile and sensitive to weather patterns, storage levels, and seasonal demand.
UNG Technical Analysis Summary
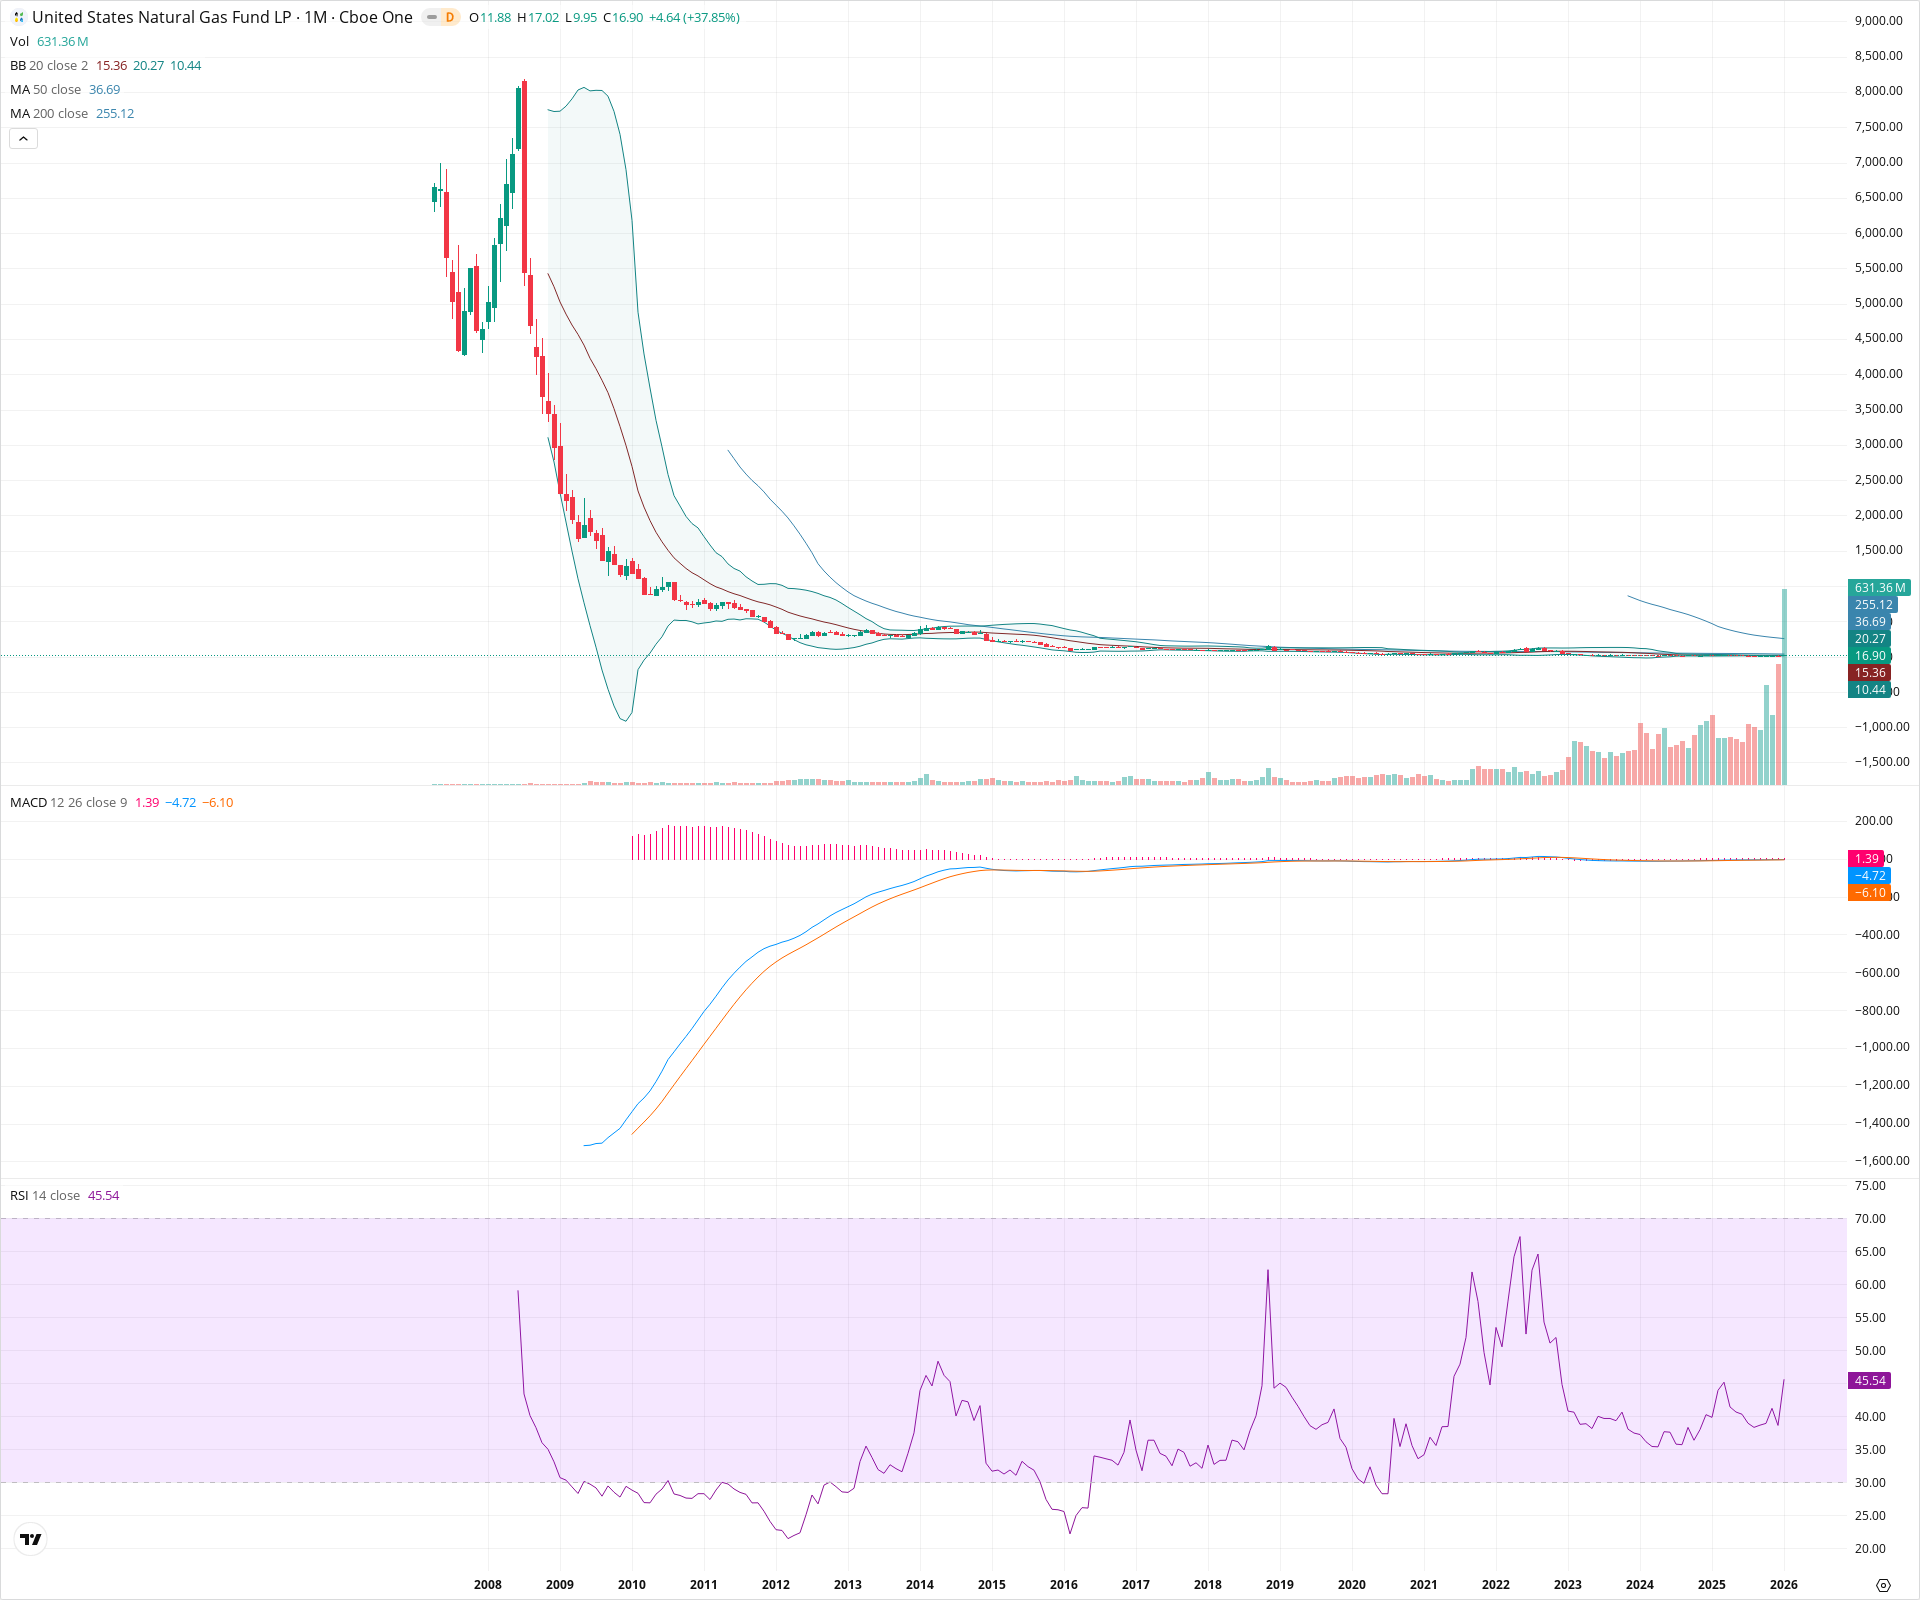
UNG remains in a deeply established long-term bear market, evidenced by price trading far below major moving averages like the 200 SMA. However, the chart shows a potential secular basing phase near historic lows, with the current month posting a significant +37% bounce off the ~10.00 support level to reclaim the 20 SMA. While short-term momentum is recovering, a break above the 50-month SMA (~36.69) is required to signal a genuine regime change for long-term investors.
Included In Lists
Related Tickers of Interest
UNG Monthly Chart
Sentiment
Short-term Sentiment (days to weeks): Bullish
The current monthly candle is showing a strong surge of +37.85%, engulfing the price action of the previous several months and reclaiming the 20-period SMA.
Long-term Sentiment (weeks to months): Bearish
The asset remains in a severe secular downtrend, trading well below the falling 50-month (36.69) and 200-month (255.12) SMAs. Despite recent stabilization, the long-term structure has not yet reversed.
Report Metadata
- Timeframe: monthly
- Generated at: 2026-02-02T07:17:42.316Z
- Model: gemini-3-pro-preview
Support Price Levels
| Level | Range | Strength | Notes |
|---|---|---|---|
| $12.19 | $11.88 - $12.50 | Weak | Current month open and recent consolidation floor. |
| $10.20 | $9.95 - $10.44 | Strong | Confluence of the current month's low, recent multi-year lows, and the Lower Bollinger Band. |
Resistance Price Levels
| Level | Range | Strength | Notes |
|---|---|---|---|
| $20.63 | $20.27 - $21.00 | Strong | Upper Bollinger Band which often acts as dynamic resistance in a downtrend/range. |
| $38.35 | $36.69 - $40.00 | Strong | 50-month SMA and the general zone of the 2022 swing highs. |
Potential Chart Patterns in Formation
| Strength | Pattern | Signal | Target | Details |
|---|---|---|---|---|
| Weak | Secular Consolidation Base | Neutral | N/A | After a massive historical decline, price has been moving sideways in a low-volatility compression zone (roughly 10-35 range) for several years, attempting to form a long-term floor. |
Frequently Asked Questions about UNG
What is the current sentiment for UNG?
The short-term sentiment for UNG is currently Bullish because The current monthly candle is showing a strong surge of +37.85%, engulfing the price action of the previous several months and reclaiming the 20-period SMA.. The long-term trend is classified as Bearish.
What are the key support levels for UNG?
StockDips.AI has identified key support levels for UNG at $12.19 and $10.20. These levels may represent potential accumulation zones where buying interest could emerge.
Is UNG in a significant dip or a Value Dip right now?
UNG has a Value Score of 42/100. It is not currently flagged as a significant dip in the Top Dips list. It is not listed as a Value Dip because the long-term sentiment or value-score threshold does not qualify.
View the full interactive analysis on StockDips.AI.