URA Monthly Technical Analysis
Global X Uranium ETF
Provides exposure to companies involved in uranium mining, nuclear fuel production, and nuclear energy infrastructure. Uranium demand is driven by global nuclear power adoption, energy security concerns, and decarbonization initiatives.
URA Technical Analysis Summary
URA has confirmed a major secular breakout, validating a long-term rounding bottom structure developed over the last decade. The price is trading well above key moving averages with expanding momentum as indicated by the MACD and Bollinger Bands. While the current vertical move may invite short-term volatility near historical resistance at 65-70, the long-term structural outlook remains decisively bullish.
Included In Lists
Related Tickers of Interest
URA Monthly Chart
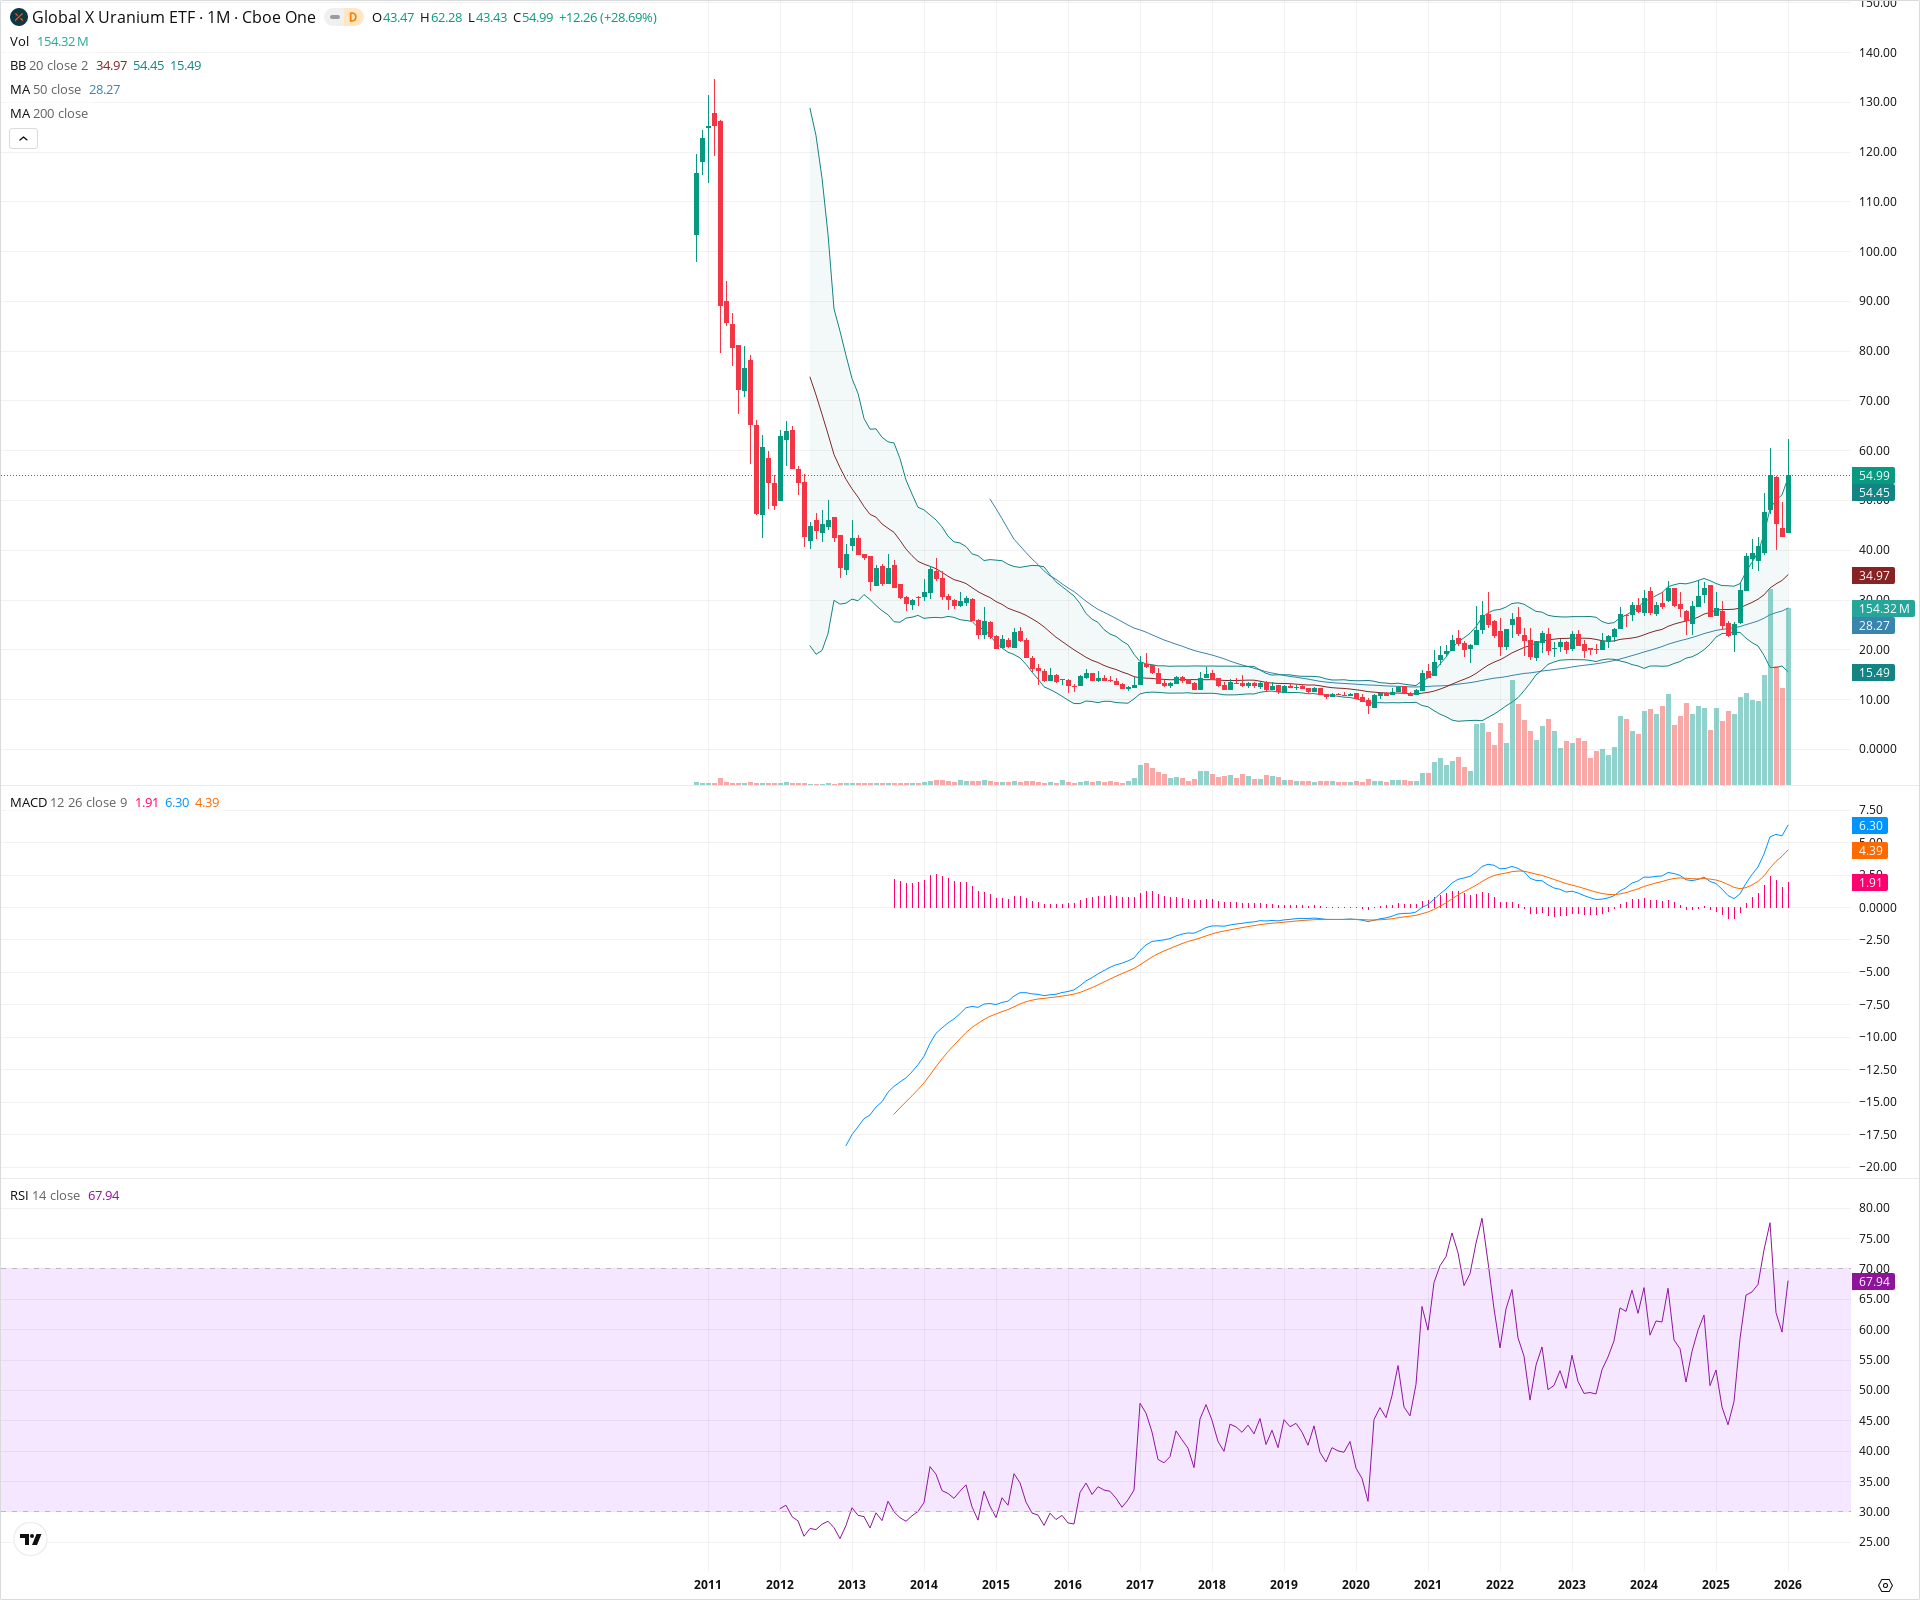
Sentiment
Short-term Sentiment (days to weeks): Bullish
Price has printed a massive bullish candle (+28.69%) pushing well above the upper Bollinger Band, indicating strong breakout momentum. RSI is rising (67.94) but not yet at extreme overbought levels.
Long-term Sentiment (weeks to months): Bullish
The chart displays a clear secular trend reversal with a 'Golden Cross' alignment where the 20 SMA (34.97) is above the 50 SMA (28.27). The monthly MACD is in a strong positive regime, confirming the long-term uptrend.
Report Metadata
- Timeframe: monthly
- Generated at: 2026-02-02T07:17:40.311Z
- Model: gemini-3-pro-preview
Support Price Levels
| Level | Range | Strength | Notes |
|---|---|---|---|
| $33.50 | $32.00 - $35.00 | Strong | Confluence of the 20-month SMA and the upper boundary of the multi-year consolidation range (2021-2023) that was recently broken. |
| $28.25 | $28.00 - $28.50 | Strong | Location of the 50-month SMA, acting as dynamic support for the medium-term trend. |
| $20.00 | $18.00 - $22.00 | Weak | Major structural base and historical demand zone. |
Resistance Price Levels
| Level | Range | Strength | Notes |
|---|---|---|---|
| $62.25 | $62.00 - $62.50 | Weak | Intraday high of the current monthly candle. |
| $70.00 | $65.00 - $75.00 | Strong | Historical supply zone from the 2011 breakdown shelf, preceding the major crash. |
Potential Chart Patterns in Formation
| Strength | Pattern | Signal | Target | Details |
|---|---|---|---|---|
| Strong | Rounding Bottom / Saucer | Bullish | N/A | A decade-long structural reversal pattern starting from the 2013 lows, forming a wide base that has now transitioned into a markup phase. |
| Strong | Multi-Year Range Breakout | Bullish | $46.00 | Price has decisively broken out of the ~$18-$32 consolidation box that contained price action from 2021 through late 2023. |
Frequently Asked Questions about URA
What is the current sentiment for URA?
The short-term sentiment for URA is currently Bullish because Price has printed a massive bullish candle (+28.69%) pushing well above the upper Bollinger Band, indicating strong breakout momentum. RSI is rising (67.94) but not yet at extreme overbought levels.. The long-term trend is classified as Bullish.
What are the key support levels for URA?
StockDips.AI has identified key support levels for URA at $33.50 and $28.25. These levels may represent potential accumulation zones where buying interest could emerge.
Is URA in a significant dip or a Value Dip right now?
URA has a Value Score of 94/100. It is currently flagged as a significant dip in the Top Dips list. It is also listed as a Value Dip because long-term sentiment is bullish.
View the full interactive analysis on StockDips.AI.