USO Monthly Technical Analysis
United States Oil Fund
Designed to track the daily price movements of West Texas Intermediate (WTI) crude oil using futures contracts. Oil prices are driven by global supply and demand, OPEC policy, geopolitics, and economic growth expectations.
USO Technical Analysis Summary
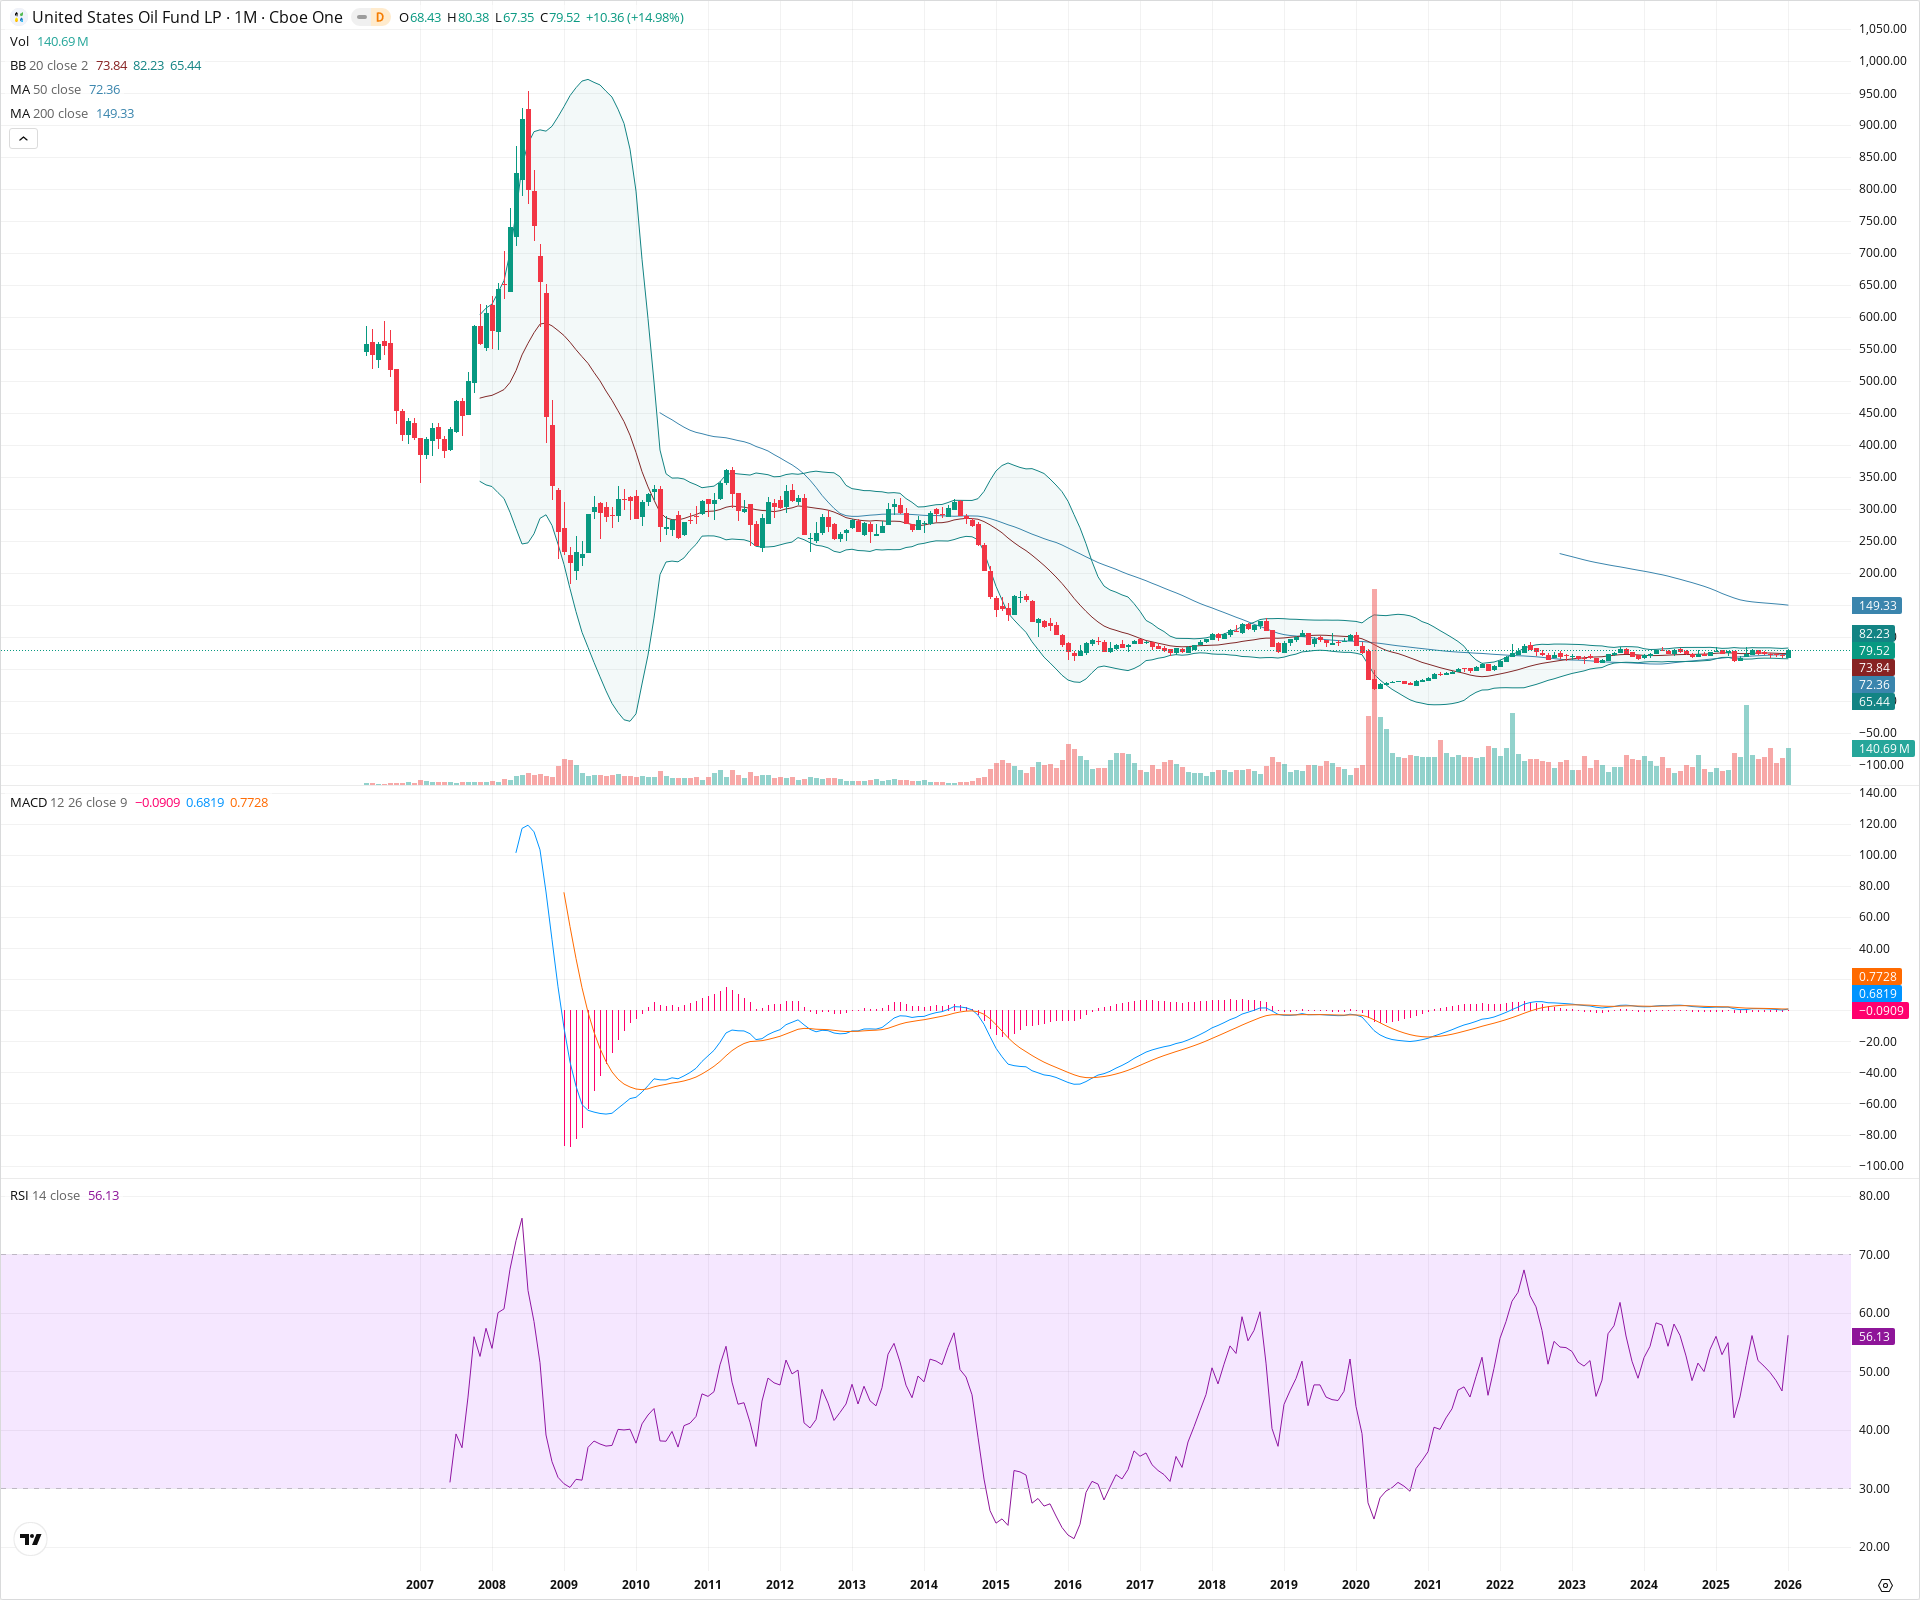
USO is currently in a prolonged stabilization phase, trading sideways within a defined range after the volatility of 2020. The recent reclaim of the 20 and 50-month SMAs is a constructive short-term development, but the long-term outlook remains neutral as the price stays contained below major structural resistance and the declining 200-month SMA. A decisive monthly close above the 90 level would be required to suggest a secular trend change.
Included In Lists
Related Tickers of Interest
USO Monthly Chart
Sentiment
Short-term Sentiment (days to weeks): Bullish
Price has posted a strong monthly gain (+14.98%), reclaiming both the 20 and 50-month SMAs and pushing toward the upper Bollinger Band.
Long-term Sentiment (weeks to months): Neutral
The asset is stuck in a multi-year consolidation base. While it has stabilized above the 50-month SMA, it remains significantly below the declining 200-month SMA, indicating a lack of secular trend reversal.
Report Metadata
- Timeframe: monthly
- Generated at: 2026-02-02T07:18:10.811Z
- Model: gemini-3-pro-preview
Support Price Levels
| Level | Range | Strength | Notes |
|---|---|---|---|
| $73.00 | $72.00 - $74.00 | Strong | Confluence of the 20-month and 50-month SMAs, acting as dynamic support. |
| $62.50 | $60.00 - $65.00 | Strong | Lower boundary of the multi-year consolidation range and lower Bollinger Band area. |
Resistance Price Levels
| Level | Range | Strength | Notes |
|---|---|---|---|
| $86.00 | $82.00 - $90.00 | Strong | Upper Bollinger Band and the swing highs established during the 2022-2023 peaks. |
| $149.50 | $149.00 - $150.00 | Strong | The 200-month SMA serves as the primary secular resistance level. |
Potential Chart Patterns in Formation
| Strength | Pattern | Signal | Target | Details |
|---|---|---|---|---|
| Strong | Multi-Year Consolidation Base | Neutral | N/A | Since recovering from the 2020 lows, price has formed a long rectangular consolidation pattern roughly between 60 and 90, indicating accumulation or stabilization. |
Frequently Asked Questions about USO
What is the current sentiment for USO?
The short-term sentiment for USO is currently Bullish because Price has posted a strong monthly gain (+14.98%), reclaiming both the 20 and 50-month SMAs and pushing toward the upper Bollinger Band.. The long-term trend is classified as Neutral.
What are the key support levels for USO?
StockDips.AI has identified key support levels for USO at $73.00 and $62.50. These levels may represent potential accumulation zones where buying interest could emerge.
Is USO in a significant dip or a Value Dip right now?
USO has a Value Score of 22/100. It is not currently flagged as a significant dip in the Top Dips list. It is not listed as a Value Dip because the long-term sentiment or value-score threshold does not qualify.
View the full interactive analysis on StockDips.AI.