ADA Weekly Technical Analysis
Cardano
ADA is the native cryptocurrency of Cardano, a Proof-of-Stake (PoS) blockchain platform built for scalability, security, and sustainability, aiming to be a "next-gen" evolution of Ethereum for smart contracts and decentralized apps (dApps)
ADA Technical Analysis Summary
ADA is firmly entrenched in a severe, long-term secular downtrend on the weekly timeframe. The technical posture significantly deteriorated following the breakdown below the critical multi-year accumulation floor at roughly 0.24, placing the asset in downward price discovery. With all major moving averages sloping downward and positioned well above the current price, any attempts at a rally will likely face heavy structural resistance until a proven long-term bottom can form.
Included In Lists
Related Tickers of Interest
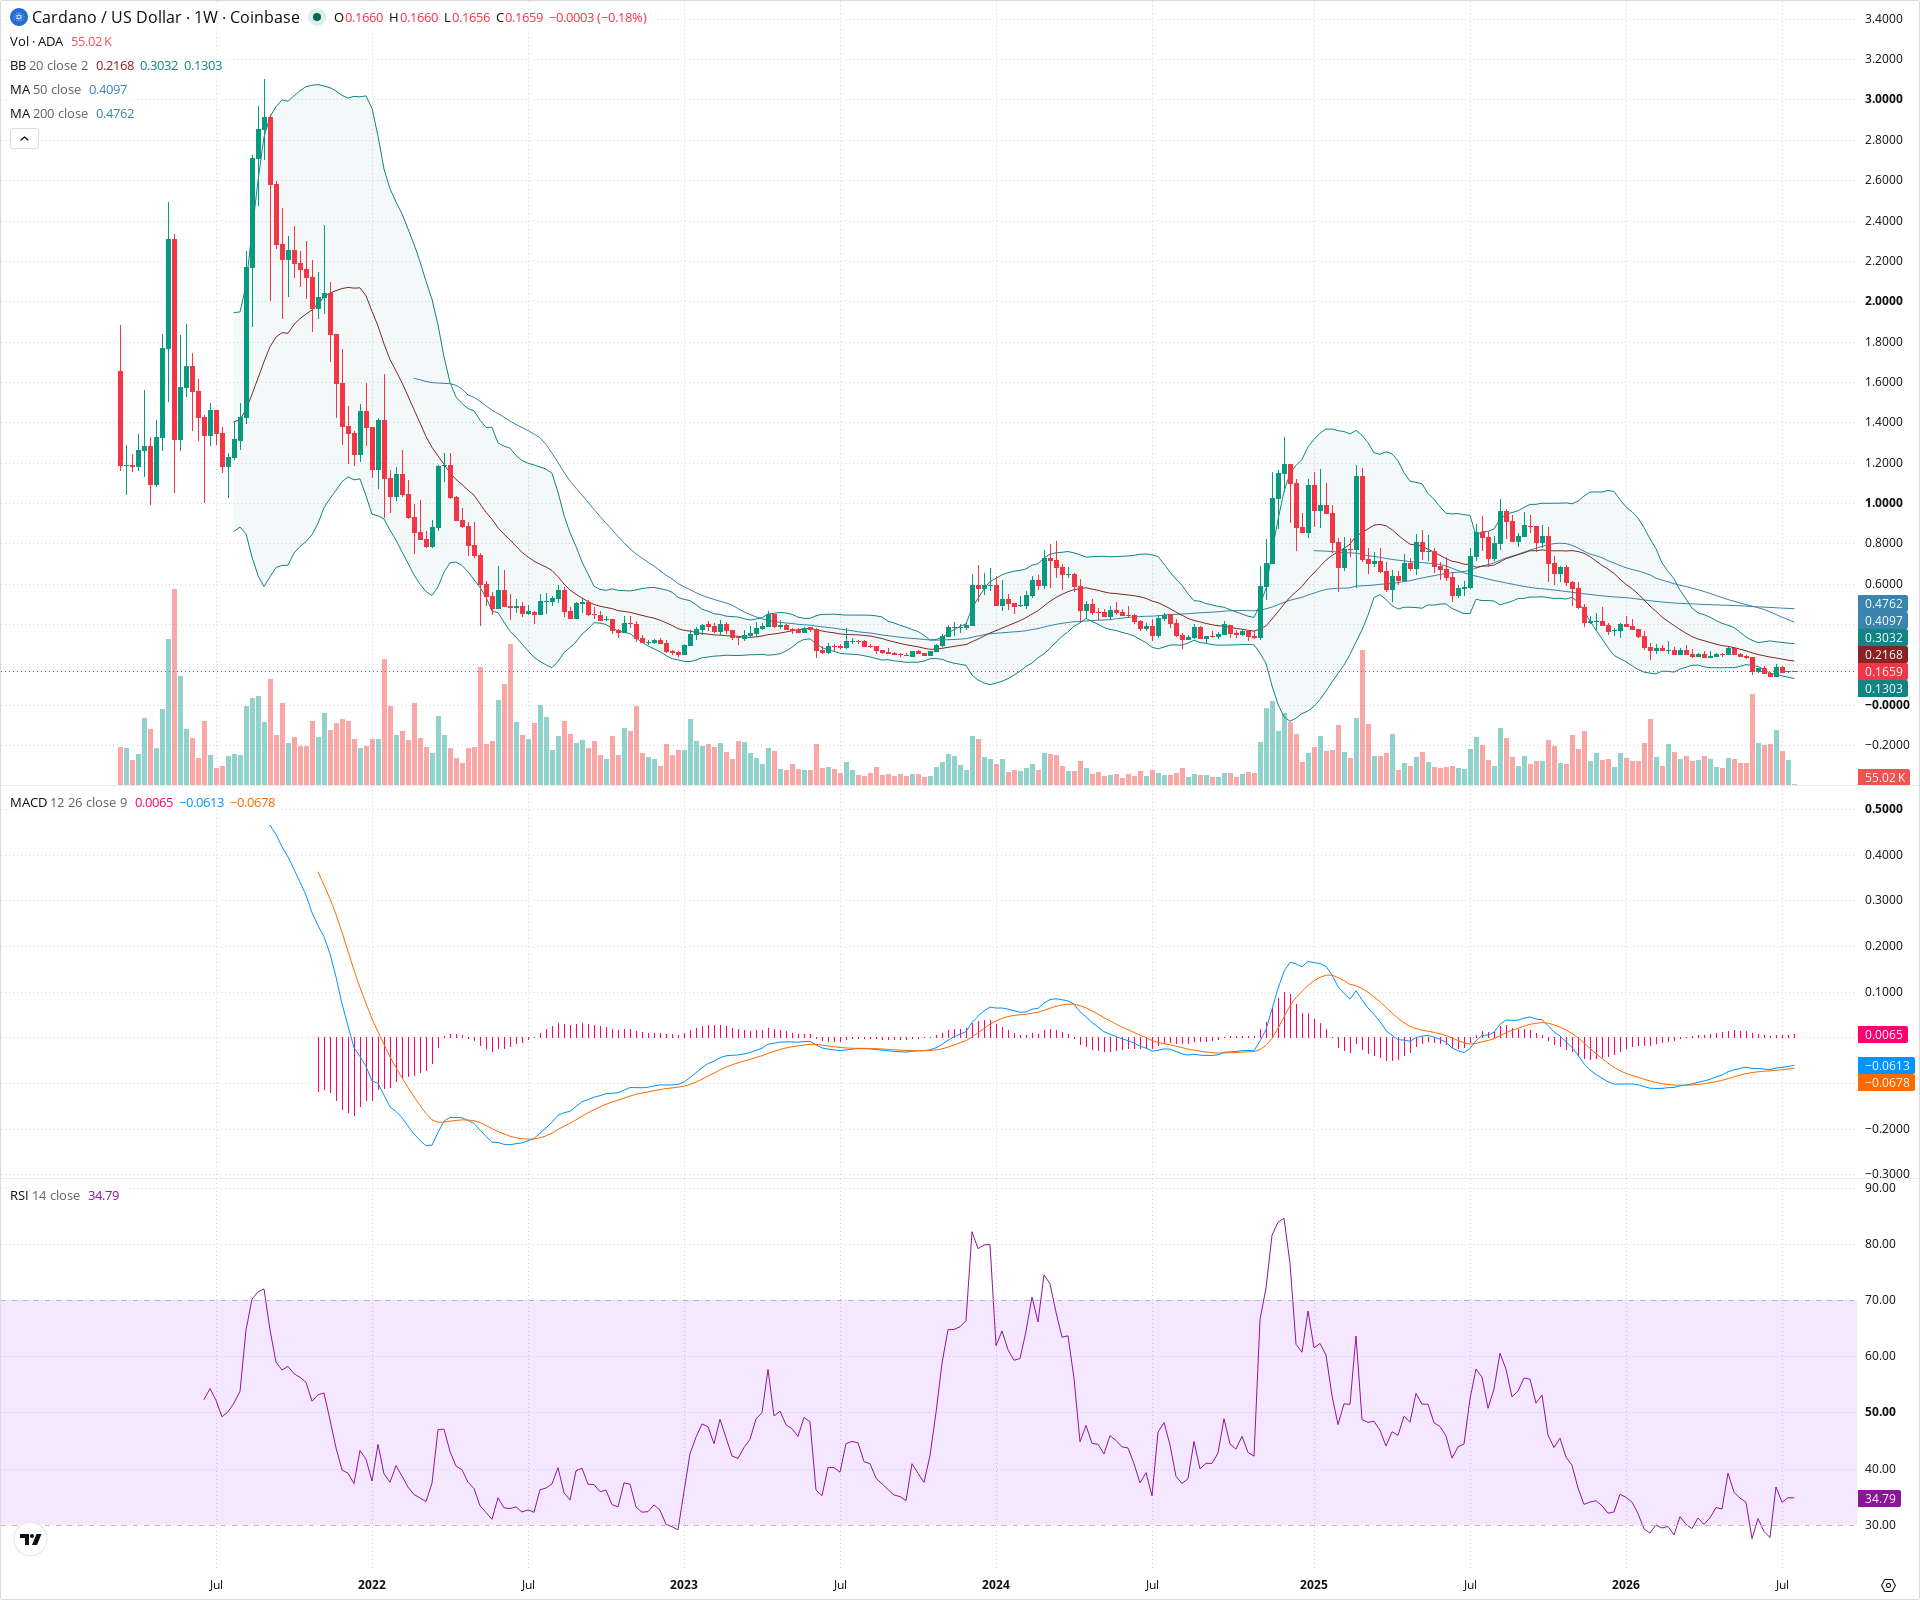
ADA Weekly Chart
Sentiment
Short-term Sentiment (days to weeks): Bearish
Price continues to make lower lows and lower highs, remaining well below the 20-week SMA, though a slightly positive MACD histogram suggests minor deceleration in downward momentum.
Long-term Sentiment (weeks to months): Bearish
The chart displays a severe multi-year downtrend with the price breaking well below major historical support, accompanied by declining 50-week and 200-week SMAs.
Report Metadata
- Timeframe: weekly
- Generated at: 2026-07-20T00:03:40.937Z
- Model: gemini-3.1-pro-preview
Support Price Levels
| Level | Range | Strength | Notes |
|---|---|---|---|
| $0.16 | $0.15 - $0.17 | Weak | Current localized low zone; price is in downward price discovery below all major structural support. |
Resistance Price Levels
| Level | Range | Strength | Notes |
|---|---|---|---|
| $0.25 | $0.23 - $0.26 | Strong | Critical previous multi-year base support, now expected to act as heavy overhead resistance. |
| $0.31 | $0.30 - $0.32 | Strong | Area of the 20-week SMA (Bollinger Band midline) and recent minor swing highs. |
| $0.44 | $0.40 - $0.48 | Strong | Major resistance zone encompassing both the declining 50-week and 200-week SMAs. |
Potential Chart Patterns in Formation
| Strength | Pattern | Signal | Target | Details |
|---|---|---|---|---|
| Strong | Support Breakdown | Bearish | N/A | Price decisively broke below the massive horizontal support floor established over multiple years around 0.23-0.25, confirming a continuation of the secular bear market. |
| Strong | Macro Downtrend | Bearish | N/A | A clear, sustained sequence of lower highs and lower lows stretching across the entire visible chart structure from the highest peak, contained below key moving averages. |
Frequently Asked Questions about ADA
What is the current sentiment for ADA?
The short-term sentiment for ADA is currently Bearish because Price continues to make lower lows and lower highs, remaining well below the 20-week SMA, though a slightly positive MACD histogram suggests minor deceleration in downward momentum.. The long-term trend is classified as Bearish.
What are the key support levels for ADA?
StockDips.AI has identified key support levels for ADA at $0.16. These levels may represent potential accumulation zones where buying interest could emerge.
Is ADA in a significant dip or a Value Dip right now?
ADA has a Value Score of 27/100. It is not currently flagged as a significant dip in the Top Dips list. It is not listed as a Value Dip because the long-term sentiment or value-score threshold does not qualify.
View the full interactive analysis on StockDips.AI.