BTC Daily Technical Analysis
Bitcoin
The first and largest cryptocurrency, created as decentralized digital money with a capped supply of 21 million coins.
BTC Technical Analysis Summary
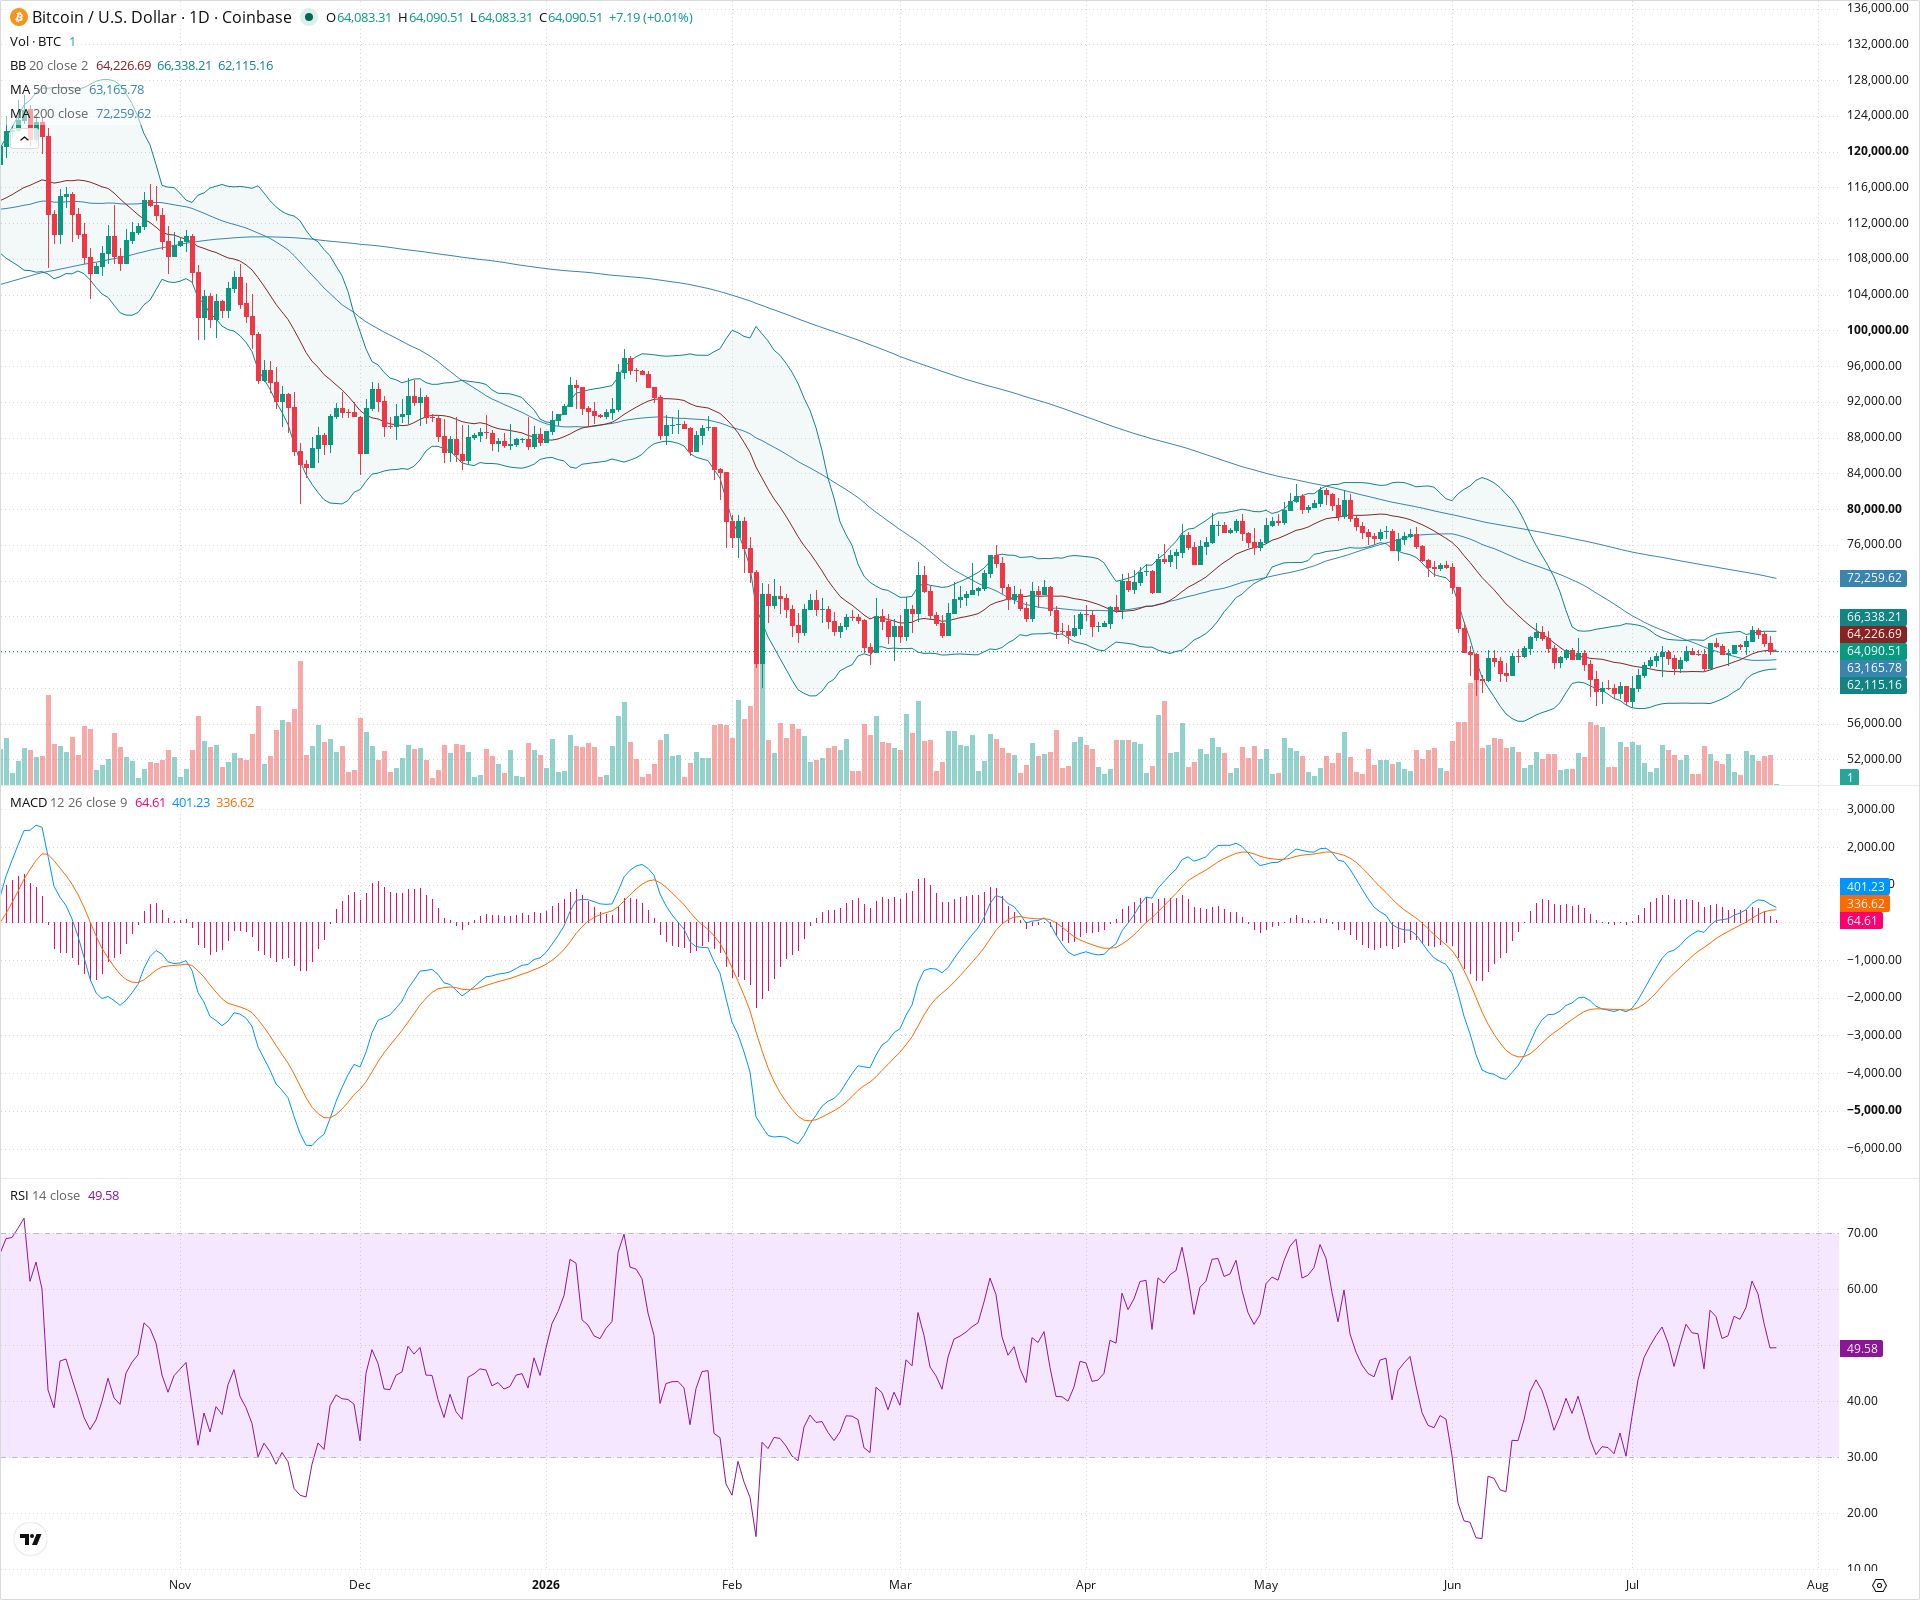
BTC shows renewed bullish momentum on the daily chart after establishing a solid double-bottom base near 54k. The price has reclaimed key moving averages (20, 50 SMA) and is currently challenging local resistance. Momentum indicators (RSI, MACD) support further upside in the near term. For long-term investors, the structural damage of the recent correction appears to be repairing, with eyes now set on the major resistance zone near 72k.
Included In Lists
Related Tickers of Interest
BTC Daily Chart
Sentiment
Short-term Sentiment (days to weeks): Bullish
Price is trading above the 20 and 50 SMAs and pushing against the upper Bollinger Band. RSI is rising steadily but not yet overbought, and MACD shows a fresh bullish crossover with positive histogram momentum.
Long-term Sentiment (weeks to months): Bullish
Price has firmly broken out of its multi-month consolidation, reclaiming the 50 SMA and pushing into the upper half of its broad long-term range. The 200 SMA remains supportive below.
Report Metadata
- Timeframe: daily
- Generated at: 2026-07-25T00:00:39.599Z
- Model: gemini-3.1-pro-preview
Support Price Levels
| Level | Range | Strength | Notes |
|---|---|---|---|
| $63,250.00 | $63,000.00 - $63,500.00 | Weak | Immediate short-term support around the 20 SMA. |
| $59,000.00 | $58,000.00 - $60,000.00 | Strong | Recent consolidation base, near the 50 SMA and lower Bollinger Band cluster. |
| $54,500.00 | $53,500.00 - $55,500.00 | Strong | Major swing lows from the June/July timeframe, forming a strong floor. |
Resistance Price Levels
| Level | Range | Strength | Notes |
|---|---|---|---|
| $67,250.00 | $66,500.00 - $68,000.00 | Weak | Immediate resistance near recent swing high and upper Bollinger Band edge. |
| $72,000.00 | $71,000.00 - $73,000.00 | Strong | Major overhead resistance cluster from the March/April/June swing highs. |
Potential Chart Patterns in Formation
| Strength | Pattern | Signal | Target | Details |
|---|---|---|---|---|
| Strong | Double Bottom / W-Bottom | Bullish | N/A | Price formed two distinct lows around the 54k area (early May and early July) before rallying. The breakout above the intervening peak (around 72k) would confirm the pattern. |
| Strong | Moving Average Breakout | Bullish | N/A | Price recently crossed back above the 50 SMA, indicating a shift in intermediate-term momentum from bearish to bullish. |
Frequently Asked Questions about BTC
What is the current sentiment for BTC?
The short-term sentiment for BTC is currently Bullish because Price is trading above the 20 and 50 SMAs and pushing against the upper Bollinger Band. RSI is rising steadily but not yet overbought, and MACD shows a fresh bullish crossover with positive histogram momentum.. The long-term trend is classified as Bullish.
What are the key support levels for BTC?
StockDips.AI has identified key support levels for BTC at $63,250.00 and $59,000.00. These levels may represent potential accumulation zones where buying interest could emerge.
Is BTC in a significant dip or a Value Dip right now?
BTC has a Value Score of 81/100. It is currently flagged as a significant dip in the Top Dips list. It is also listed as a Value Dip because long-term sentiment is bullish.
View the full interactive analysis on StockDips.AI.