ADA Daily Technical Analysis
Cardano
ADA is the native cryptocurrency of Cardano, a Proof-of-Stake (PoS) blockchain platform built for scalability, security, and sustainability, aiming to be a "next-gen" evolution of Ethereum for smart contracts and decentralized apps (dApps)
ADA Technical Analysis Summary
ADA remains entrenched in a macro downtrend, with price action suppressed heavily by descending 50-day and 200-day moving averages. Following a significant drop in June, the asset is currently carving out a weak consolidation pattern that resembles a bearish flag. Unless bulls can muster the momentum to break and hold above the 50-day SMA, the path of least resistance appears to remain to the downside.
Included In Lists
Related Tickers of Interest
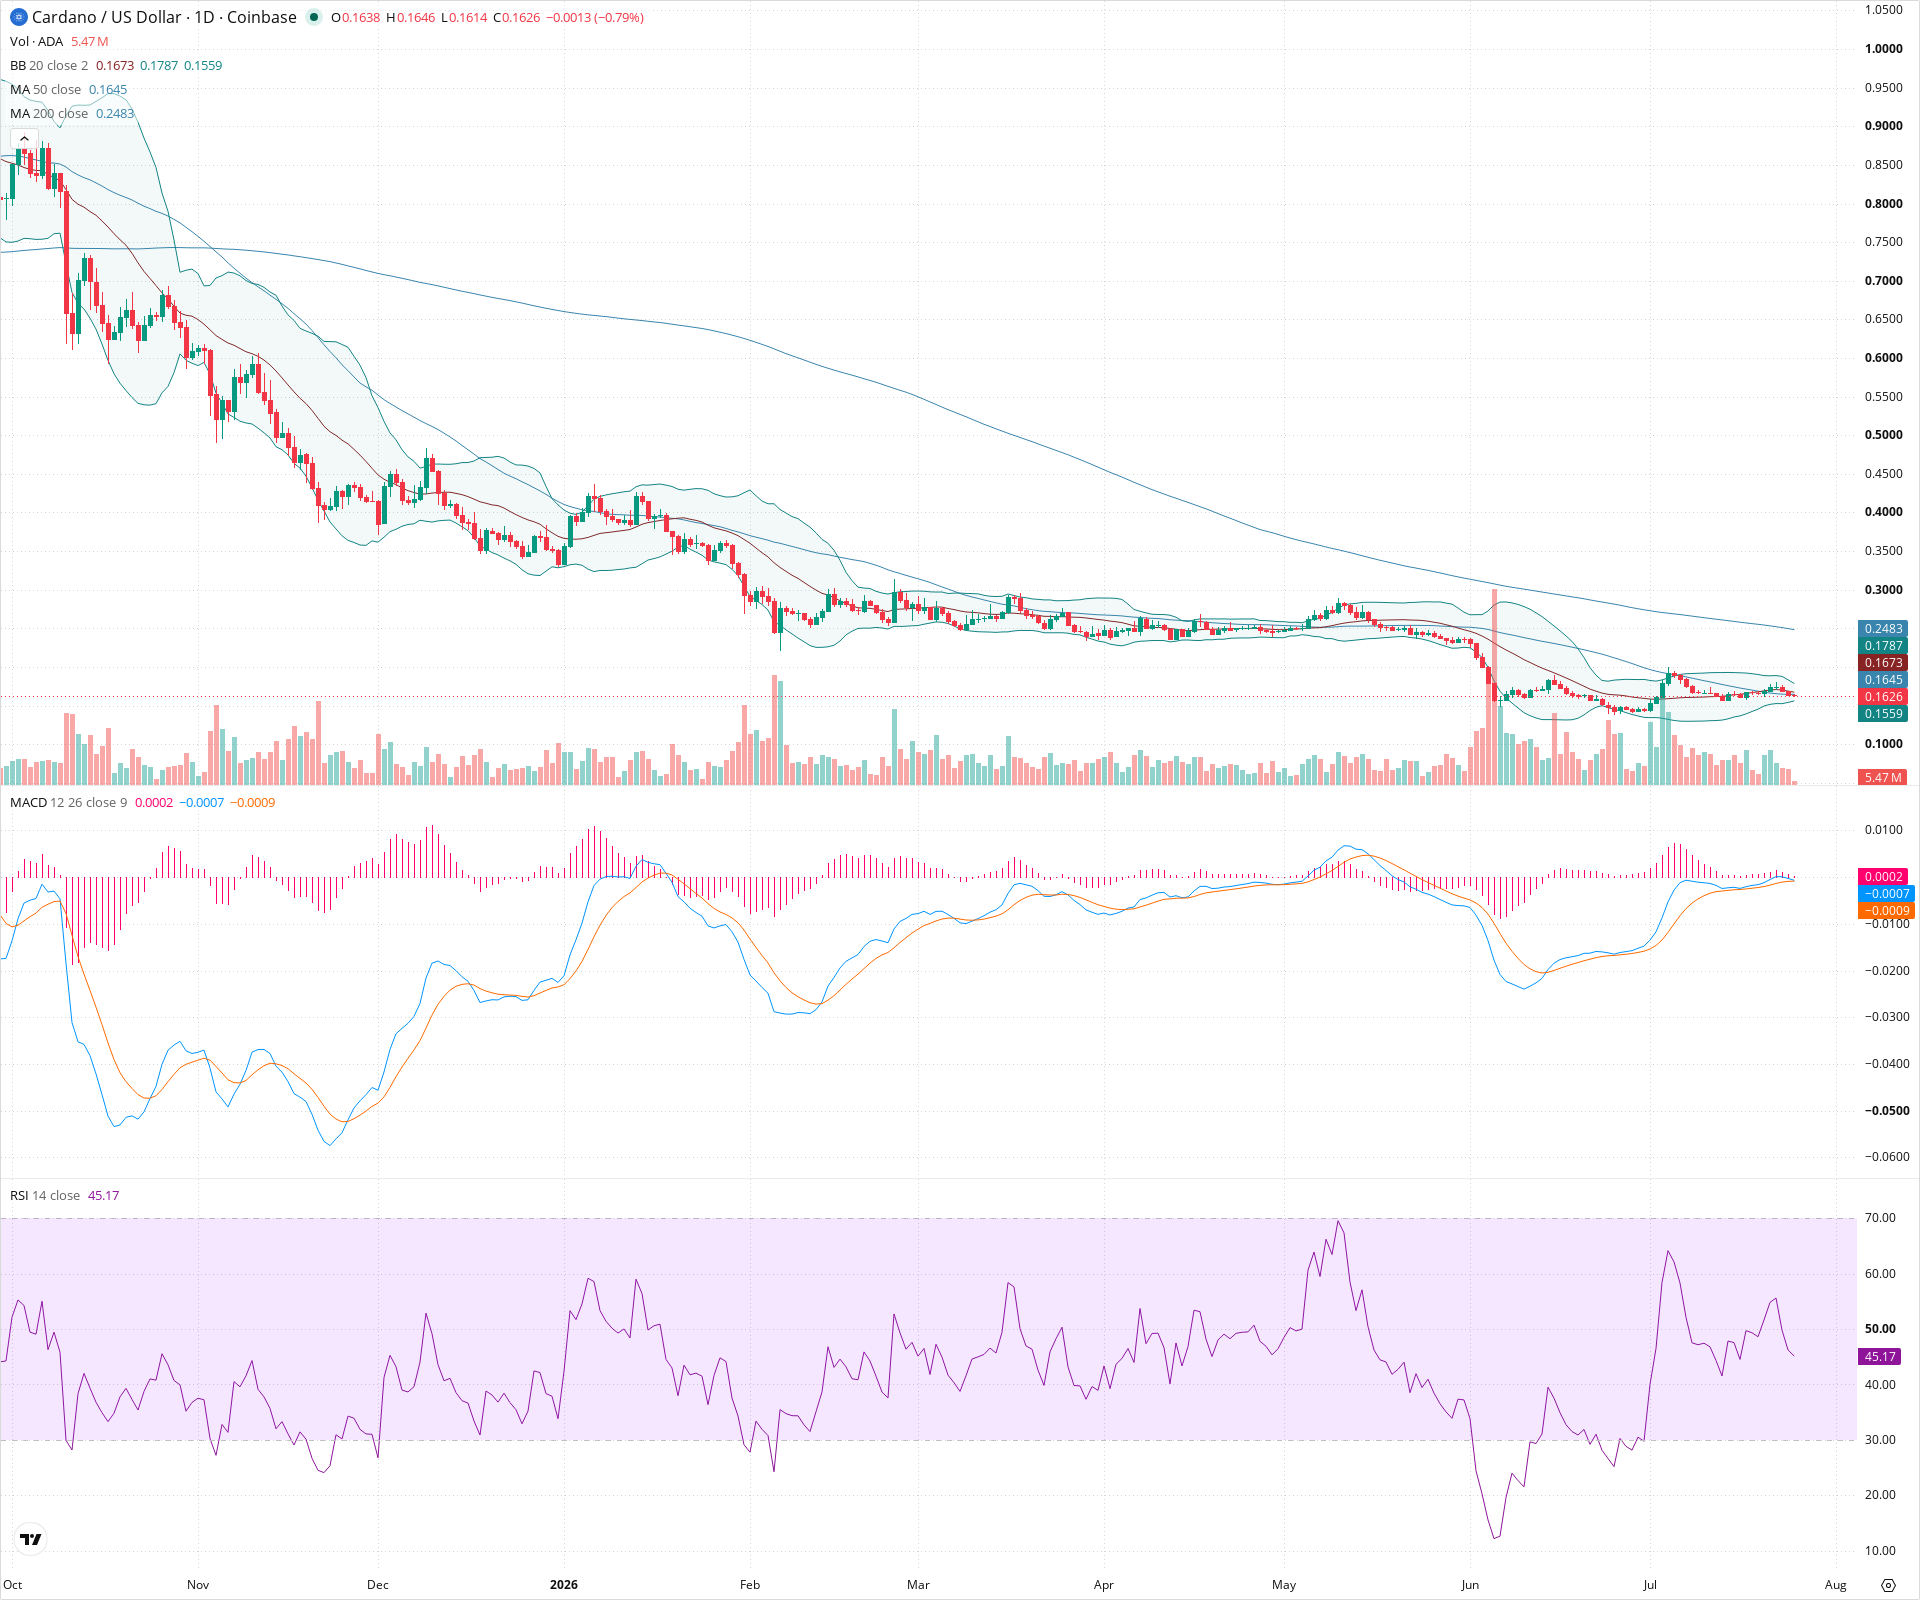
ADA Daily Chart
Sentiment
Short-term Sentiment (days to weeks): Neutral
Price is consolidating in a tight range after a steep drop, fluctuating between the middle and lower Bollinger Bands while hovering just below the 50-day SMA. The RSI near 45 and a nearly flat MACD histogram indicate a lack of directional momentum.
Long-term Sentiment (weeks to months): Bearish
The dominant trend remains firmly downwards, evidenced by a sustained sequence of lower highs and lower lows. The price is trading well below a steeply declining 200-day SMA and a downward-sloping 50-day SMA.
Report Metadata
- Timeframe: daily
- Generated at: 2026-07-25T12:04:53.898Z
- Model: gemini-3.1-pro-preview
Support Price Levels
| Level | Range | Strength | Notes |
|---|---|---|---|
| $0.15 | $0.15 - $0.16 | Weak | Recent consolidation low and proximity to the lower Bollinger Band (0.1559). |
| $0.14 | $0.13 - $0.14 | Strong | Major swing low established during the sharp capitulation wick in June. |
Resistance Price Levels
| Level | Range | Strength | Notes |
|---|---|---|---|
| $0.17 | $0.16 - $0.17 | Moderate | Immediate resistance cluster encompassing the 50-day SMA (0.1645) and the 20-day SMA / middle Bollinger Band (0.1673). |
| $0.21 | $0.20 - $0.22 | Strong | Previous prolonged consolidation range that acted as support before the June breakdown, now serving as heavy overhead resistance. |
Potential Chart Patterns in Formation
| Strength | Pattern | Signal | Target | Details |
|---|---|---|---|---|
| Moderate | Bearish Pennant / Flag | Bearish | N/A | Following the aggressive sell-off in June, the price is forming a weak, sideways-to-slightly-upward consolidation pattern below moving average resistance, typical of a bearish continuation setup. |
| Strong | Downtrend | Bearish | N/A | A clear, overarching structural pattern of lower highs and lower lows stretching across the entire visible chart, guided lower by the 50-day and 200-day SMAs. |
Frequently Asked Questions about ADA
What is the current sentiment for ADA?
The short-term sentiment for ADA is currently Neutral because Price is consolidating in a tight range after a steep drop, fluctuating between the middle and lower Bollinger Bands while hovering just below the 50-day SMA. The RSI near 45 and a nearly flat MACD histogram indicate a lack of directional momentum.. The long-term trend is classified as Bearish.
What are the key support levels for ADA?
StockDips.AI has identified key support levels for ADA at $0.15 and $0.14. These levels may represent potential accumulation zones where buying interest could emerge.
Is ADA in a significant dip or a Value Dip right now?
ADA has a Value Score of 31/100. It is not currently flagged as a significant dip in the Top Dips list. It is not listed as a Value Dip because the long-term sentiment or value-score threshold does not qualify.
View the full interactive analysis on StockDips.AI.