ETH Daily Technical Analysis
Ethereum
Blockchain platform that enables smart contracts and decentralized applications (dApps).
ETH Technical Analysis Summary
ETH is currently experiencing a period of consolidation after a recent recovery from June lows. The short-term picture shows price stabilizing above key short-term moving averages, but momentum indicators like RSI and MACD are moderating. Long-term, the asset remains range-bound, trapped below the significant resistance of the 200-day SMA and prior highs, suggesting investors wait for a decisive breakout above 2000 for a more convincing bullish shift.
Included In Lists
Related Tickers of Interest
ETH Daily Chart
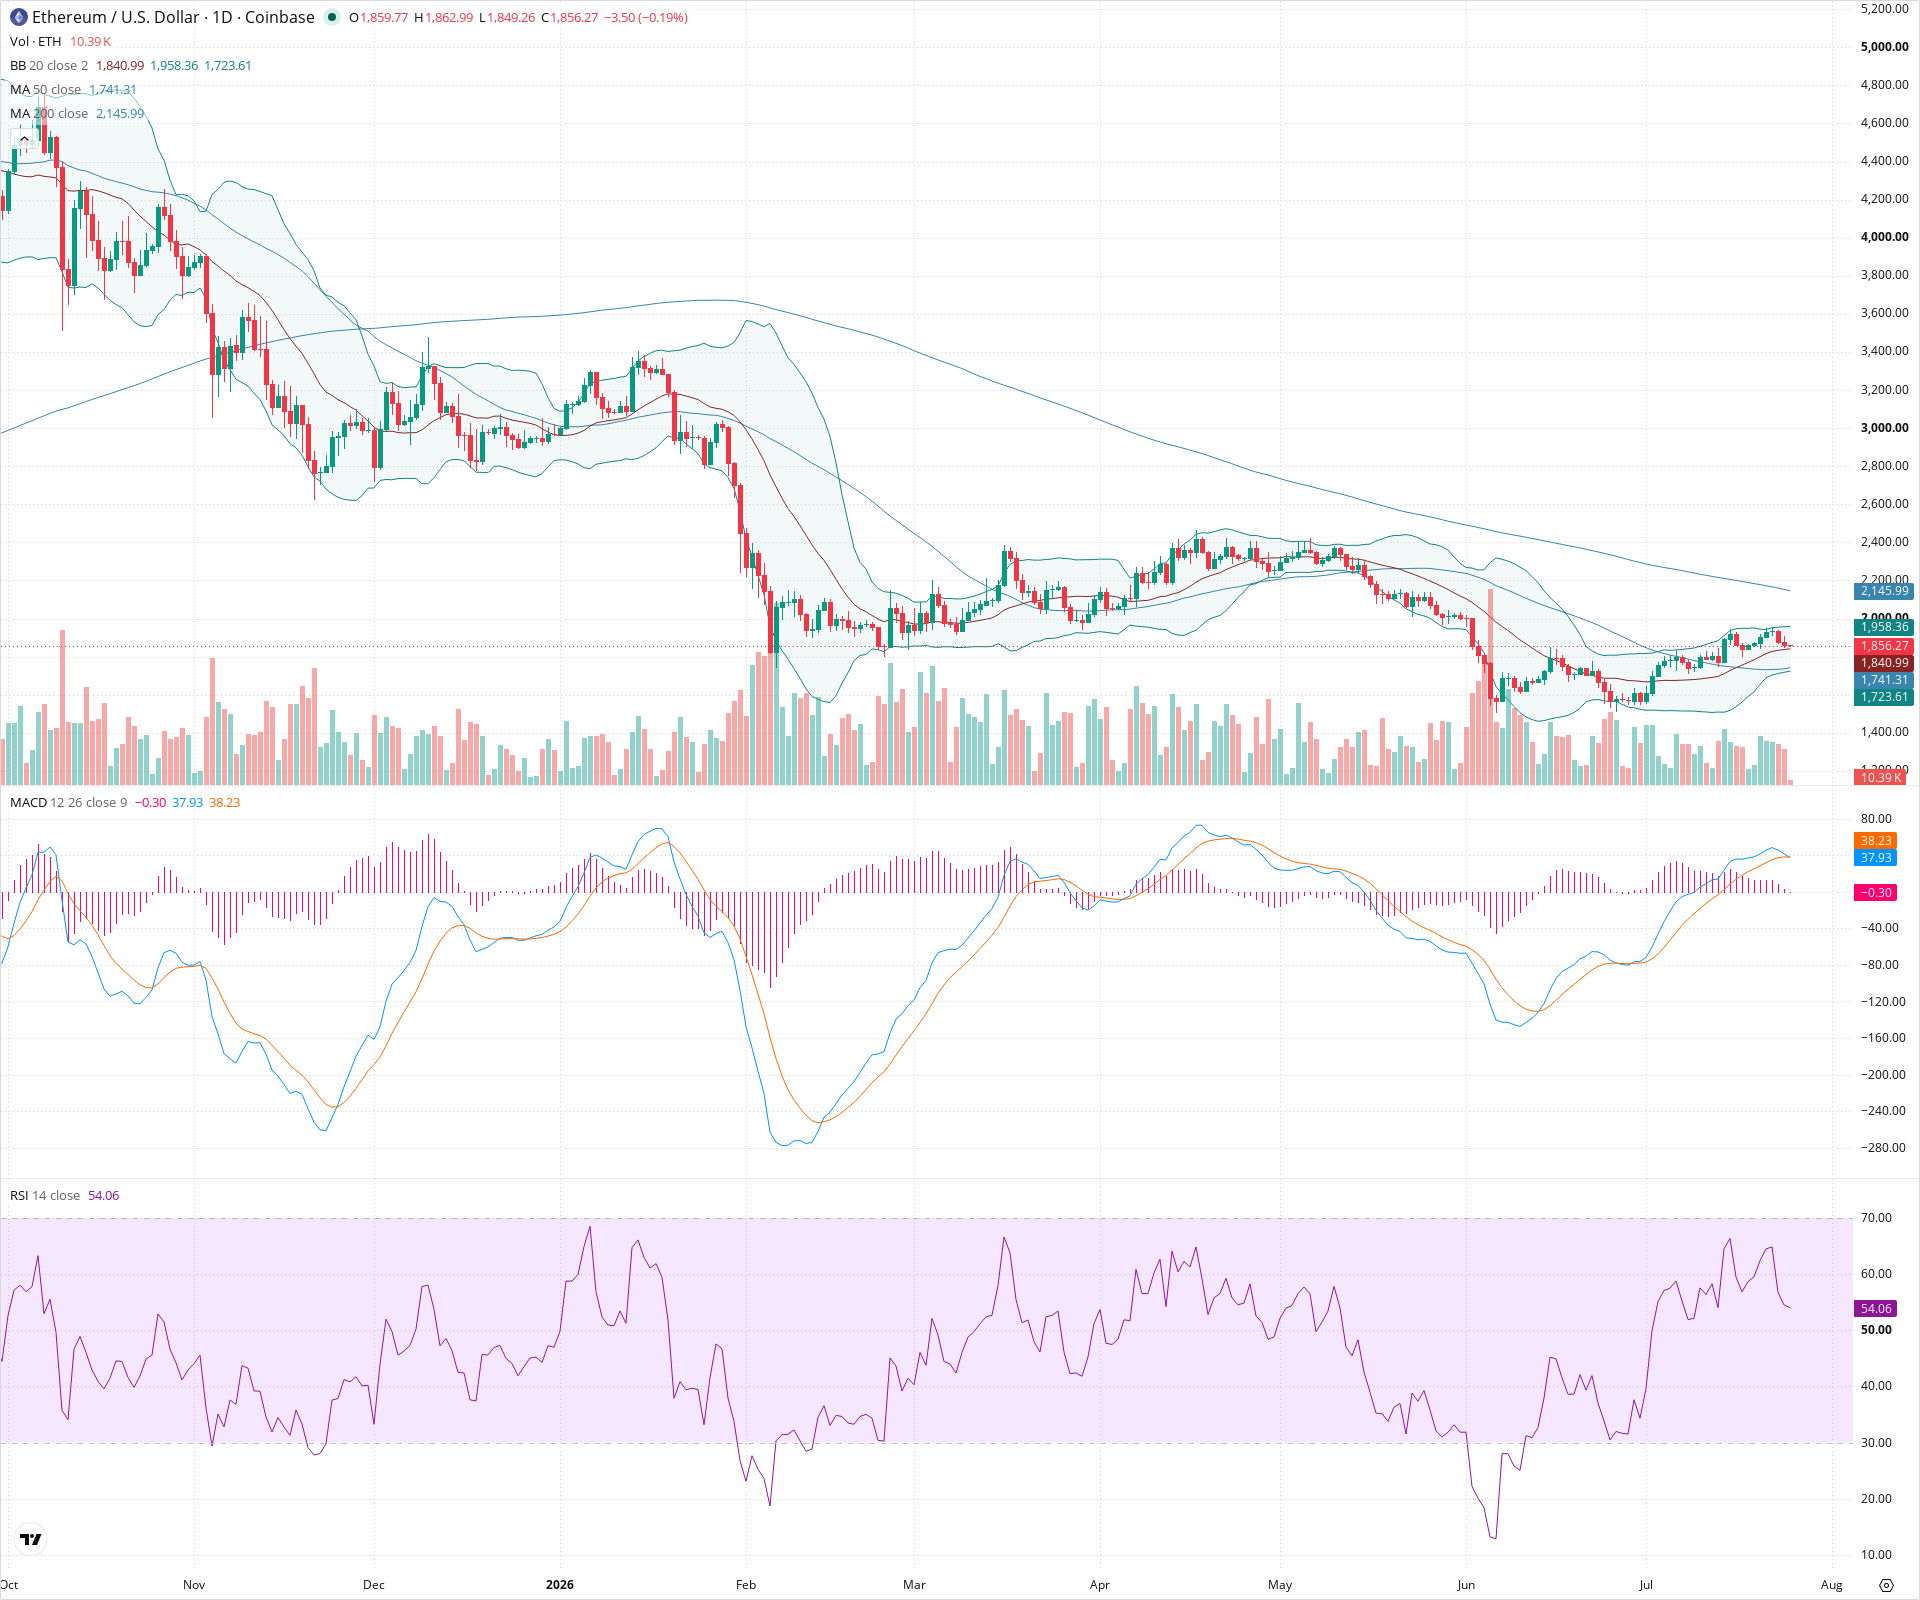
Sentiment
Short-term Sentiment (days to weeks): Neutral
Price is consolidating within the upper half of the Bollinger Bands, finding support near the 20-day SMA, while RSI is cooling off around 54 and MACD histogram is trending downwards despite lines remaining positive, suggesting a pause in momentum.
Long-term Sentiment (weeks to months): Neutral
The 50-day SMA has crossed below the 200-day SMA previously, and price is currently sandwiched between the 50-day support and 200-day resistance, indicating a larger sideways consolidation phase without clear long-term direction.
Report Metadata
- Timeframe: daily
- Generated at: 2026-07-25T12:01:21.398Z
- Model: gemini-3.1-pro-preview
Support Price Levels
| Level | Range | Strength | Notes |
|---|---|---|---|
| $1,735.00 | $1,720.00 - $1,750.00 | Strong | Recent swing lows and convergence of the 20-day and 50-day SMAs. |
| $1,625.00 | $1,600.00 - $1,650.00 | Strong | Major swing low established in June. |
Resistance Price Levels
| Level | Range | Strength | Notes |
|---|---|---|---|
| $1,975.00 | $1,950.00 - $2,000.00 | Strong | Recent local highs and proximity to the upper Bollinger Band. |
| $2,125.00 | $2,100.00 - $2,150.00 | Strong | Major prior peak from April and location of the declining 200-day SMA. |
Potential Chart Patterns in Formation
| Strength | Pattern | Signal | Target | Details |
|---|---|---|---|---|
| Weak | Ascending Triangle (potential) | Bullish | N/A | Higher lows forming since the June bottom, meeting horizontal resistance around 2000, though still developing. |
Frequently Asked Questions about ETH
What is the current sentiment for ETH?
The short-term sentiment for ETH is currently Neutral because Price is consolidating within the upper half of the Bollinger Bands, finding support near the 20-day SMA, while RSI is cooling off around 54 and MACD histogram is trending downwards despite lines remaining positive, suggesting a pause in momentum.. The long-term trend is classified as Neutral.
What are the key support levels for ETH?
StockDips.AI has identified key support levels for ETH at $1,735.00 and $1,625.00. These levels may represent potential accumulation zones where buying interest could emerge.
Is ETH in a significant dip or a Value Dip right now?
ETH has a Value Score of 50/100. It is not currently flagged as a significant dip in the Top Dips list. It is not listed as a Value Dip because the long-term sentiment or value-score threshold does not qualify.
View the full interactive analysis on StockDips.AI.