XRP Daily Technical Analysis
XRP
Designed for fast and low-cost cross-border payments and remittances.
XRP Technical Analysis Summary
XRP is entrenched in a formidable long-term downtrend, trading well below all major moving averages. Recently, the asset has found temporary footing near the $1.00 psychological level, entering a sideways consolidation phase that resembles a bearish continuation pattern. Until the price can print a higher high and decisively reclaim the 50-day SMA resistance zone, the overarching technical posture remains bearish, favoring further downside resolution.
Included In Lists
Related Tickers of Interest
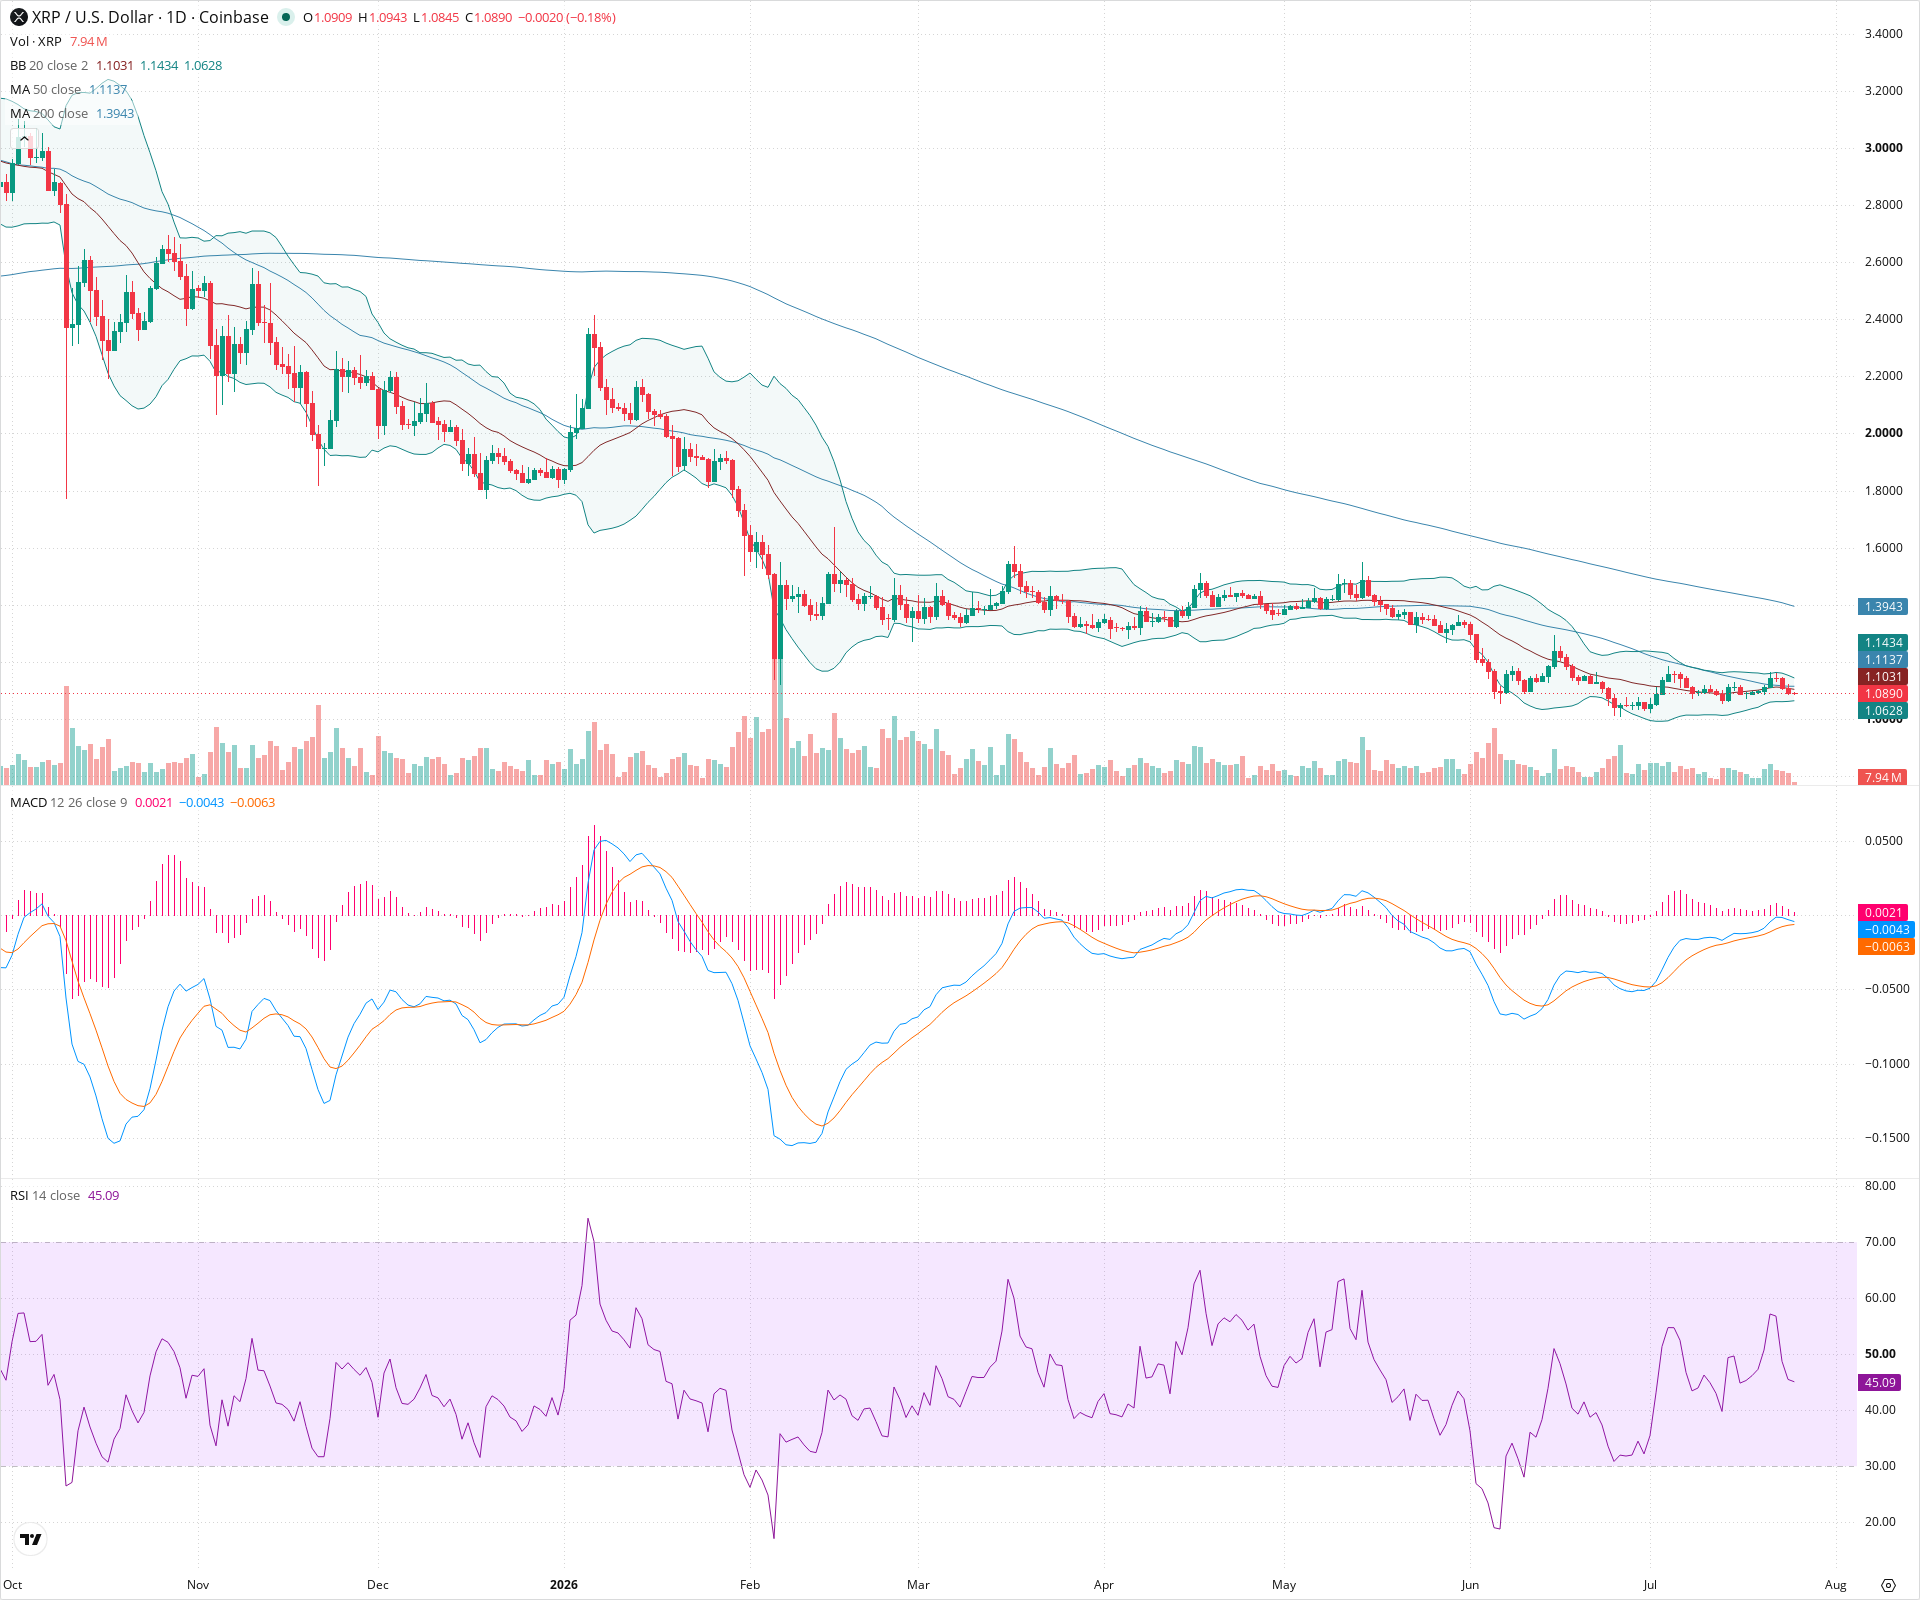
XRP Daily Chart
Sentiment
Short-term Sentiment (days to weeks): Neutral
Price is consolidating in a tight range between the lower Bollinger Band and the 50-day SMA. The RSI is near the midpoint (45.09), and while the MACD has had a slight bullish crossover below the zero line, momentum is weak and directionless.
Long-term Sentiment (weeks to months): Bearish
The chart shows a clear, sustained downtrend defined by a series of lower highs and lower lows. Price remains significantly below the downward-sloping 50-day and 200-day simple moving averages, indicating robust long-term technical weakness.
Report Metadata
- Timeframe: daily
- Generated at: 2026-07-25T12:01:37.797Z
- Model: gemini-3.1-pro-preview
Support Price Levels
| Level | Range | Strength | Notes |
|---|---|---|---|
| $1.06 | $1.05 - $1.07 | Weak | Immediate short-term support established by the lows of the most recent daily candles. |
| $1.00 | $0.98 - $1.02 | Strong | Recent swing low zone from late June, acting as a major floor halting the recent aggressive sell-off. |
Resistance Price Levels
| Level | Range | Strength | Notes |
|---|---|---|---|
| $1.13 | $1.11 - $1.15 | Strong | Confluence zone including the descending 50-day SMA and recent lower highs from early July, which price has failed to break above. |
| $1.23 | $1.20 - $1.25 | Moderate | Prior structural consolidation zone and swing high from late May before the next leg down. |
| $1.39 | $1.38 - $1.40 | Strong | Area of the 200-day SMA and previous resistance level from March and April. |
Potential Chart Patterns in Formation
| Strength | Pattern | Signal | Target | Details |
|---|---|---|---|---|
| Strong | Bearish Consolidation / Bear Flag | Bearish | N/A | Following a steep drop from above $1.60, the price has entered a sideways consolidation phase roughly between $1.00 and $1.15. This pattern typically resolves in the direction of the prior trend. |
Frequently Asked Questions about XRP
What is the current sentiment for XRP?
The short-term sentiment for XRP is currently Neutral because Price is consolidating in a tight range between the lower Bollinger Band and the 50-day SMA. The RSI is near the midpoint (45.09), and while the MACD has had a slight bullish crossover below the zero line, momentum is weak and directionless.. The long-term trend is classified as Bearish.
What are the key support levels for XRP?
StockDips.AI has identified key support levels for XRP at $1.06 and $1.00. These levels may represent potential accumulation zones where buying interest could emerge.
Is XRP in a significant dip or a Value Dip right now?
XRP has a Value Score of 57/100. It is not currently flagged as a significant dip in the Top Dips list. It is not listed as a Value Dip because the long-term sentiment or value-score threshold does not qualify.
View the full interactive analysis on StockDips.AI.