ZEC Daily Technical Analysis
ZCash
Zcash (ZEC) is a privacy-focused cryptocurrency that enables optional anonymity for transactions by using advanced cryptography. While the Zcash protocol governs the network, ZEC is the native monetary unit, or coin, used for transactions.
ZEC Technical Analysis Summary
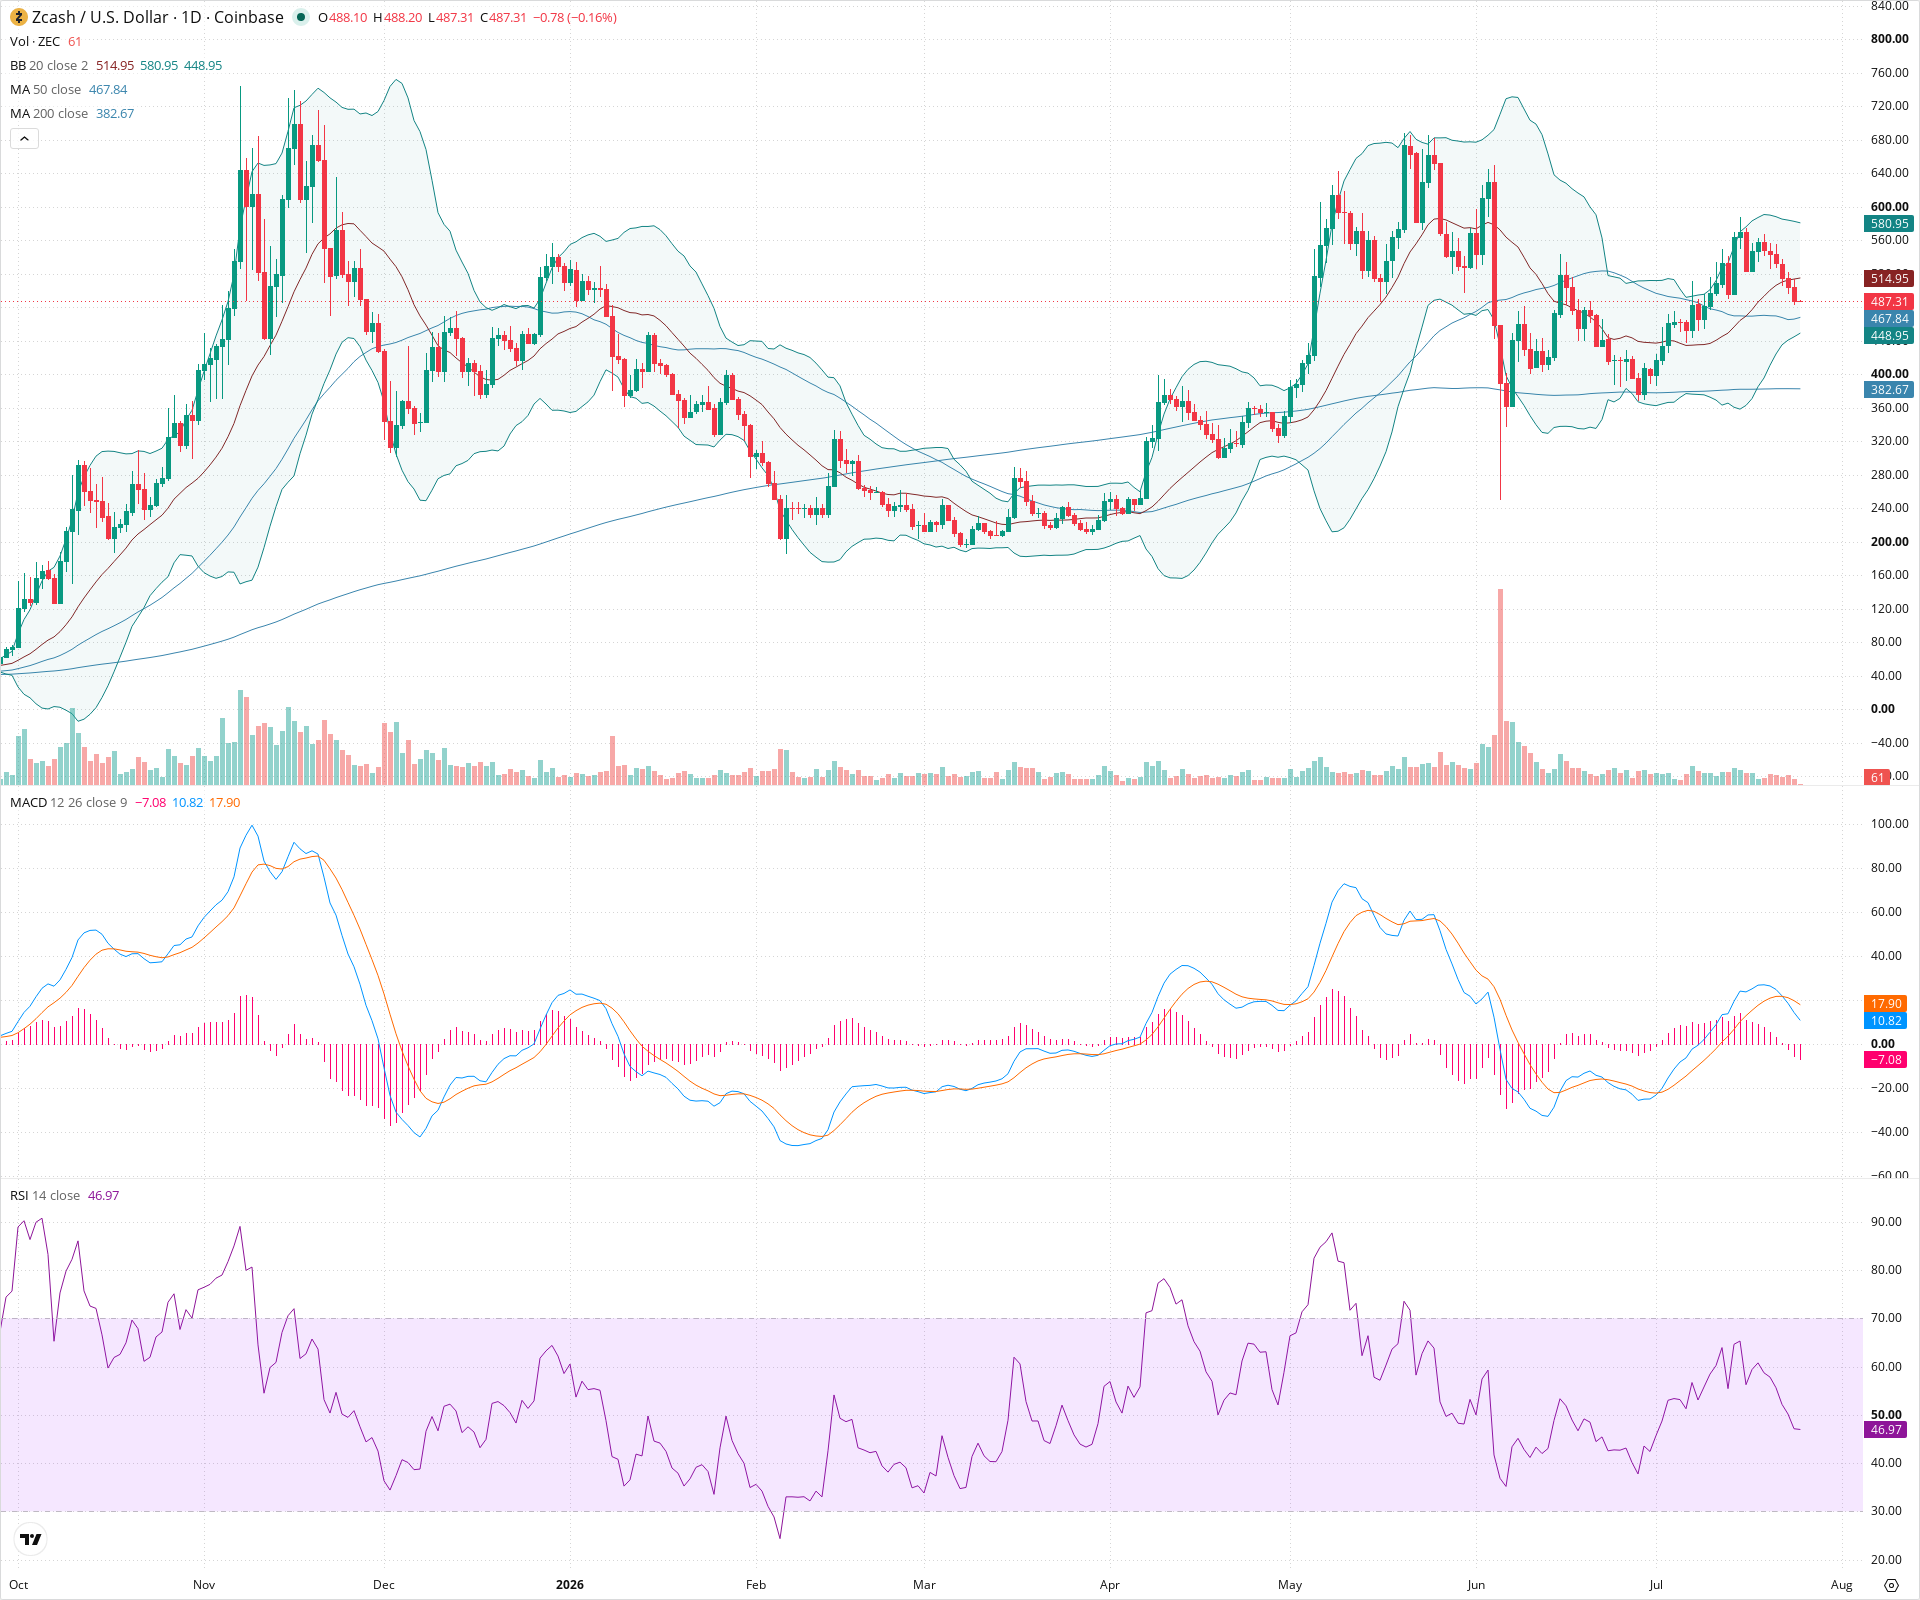
ZEC remains in a macro uptrend, evidenced by price sustaining levels above the upward-sloping 200-day SMA. However, the short-term technical picture is corrective as momentum indicators like the MACD and RSI weaken, and price makes lower highs. The critical support zone to watch is 440-470; holding this area is vital for bulls to preserve the broader uptrend structure.
Included In Lists
Related Tickers of Interest
ZEC Daily Chart
Sentiment
Short-term Sentiment (days to weeks): Bearish
Price is trading below the 20-day SMA, the MACD shows a recent bearish crossover with an expanding negative histogram, and the RSI is pointing downwards just below the neutral 50 level.
Long-term Sentiment (weeks to months): Bullish
The price remains comfortably above the rising 200-day SMA, and the 50-day SMA is also trending upwards above the 200-day SMA, maintaining a long-term bullish market structure.
Report Metadata
- Timeframe: daily
- Generated at: 2026-07-25T00:01:46.199Z
- Model: gemini-3.1-pro-preview
Support Price Levels
| Level | Range | Strength | Notes |
|---|---|---|---|
| $455.00 | $440.00 - $470.00 | Strong | Zone encompassing recent swing lows, the lower Bollinger Band, and the rising 50-day SMA. |
| $375.00 | $360.00 - $390.00 | Strong | Major previous consolidation zone and structural swing low area, reinforced by the approaching 200-day SMA. |
Resistance Price Levels
| Level | Range | Strength | Notes |
|---|---|---|---|
| $565.00 | $550.00 - $580.00 | Strong | Recent lower high peaks and the vicinity of the upper Bollinger Band. |
| $740.00 | $720.00 - $760.00 | Strong | Major historical peaks forming significant overhead resistance. |
Potential Chart Patterns in Formation
| Strength | Pattern | Signal | Target | Details |
|---|---|---|---|---|
| Strong | Corrective Channel | Bearish | N/A | Since the local peak near 600, price action has formed a series of lower highs and lower lows, indicating a short-term corrective phase within the larger macro uptrend. |
Frequently Asked Questions about ZEC
What is the current sentiment for ZEC?
The short-term sentiment for ZEC is currently Bearish because Price is trading below the 20-day SMA, the MACD shows a recent bearish crossover with an expanding negative histogram, and the RSI is pointing downwards just below the neutral 50 level.. The long-term trend is classified as Bullish.
What are the key support levels for ZEC?
StockDips.AI has identified key support levels for ZEC at $455.00 and $375.00. These levels may represent potential accumulation zones where buying interest could emerge.
Is ZEC in a significant dip or a Value Dip right now?
ZEC has a Value Score of 79/100. It is currently flagged as a significant dip in the Top Dips list. It is also listed as a Value Dip because long-term sentiment is bullish.
View the full interactive analysis on StockDips.AI.