BNB Daily Technical Analysis
Binance Coin
Utility token of the Binance ecosystem, used for transaction fees and blockchain operations.
BNB Technical Analysis Summary
BNB is currently entrenched in a severe, long-term downtrend across the daily timeframe. Price action is capped by all major moving averages, with the 50-day SMA acting as consistent dynamic resistance. While short-term momentum indicators like the MACD and RSI suggest selling pressure may be temporarily exhausted at current levels, the overarching market structure remains firmly bearish until a significant higher high is established above the 600 level.
Included In Lists
Related Tickers of Interest
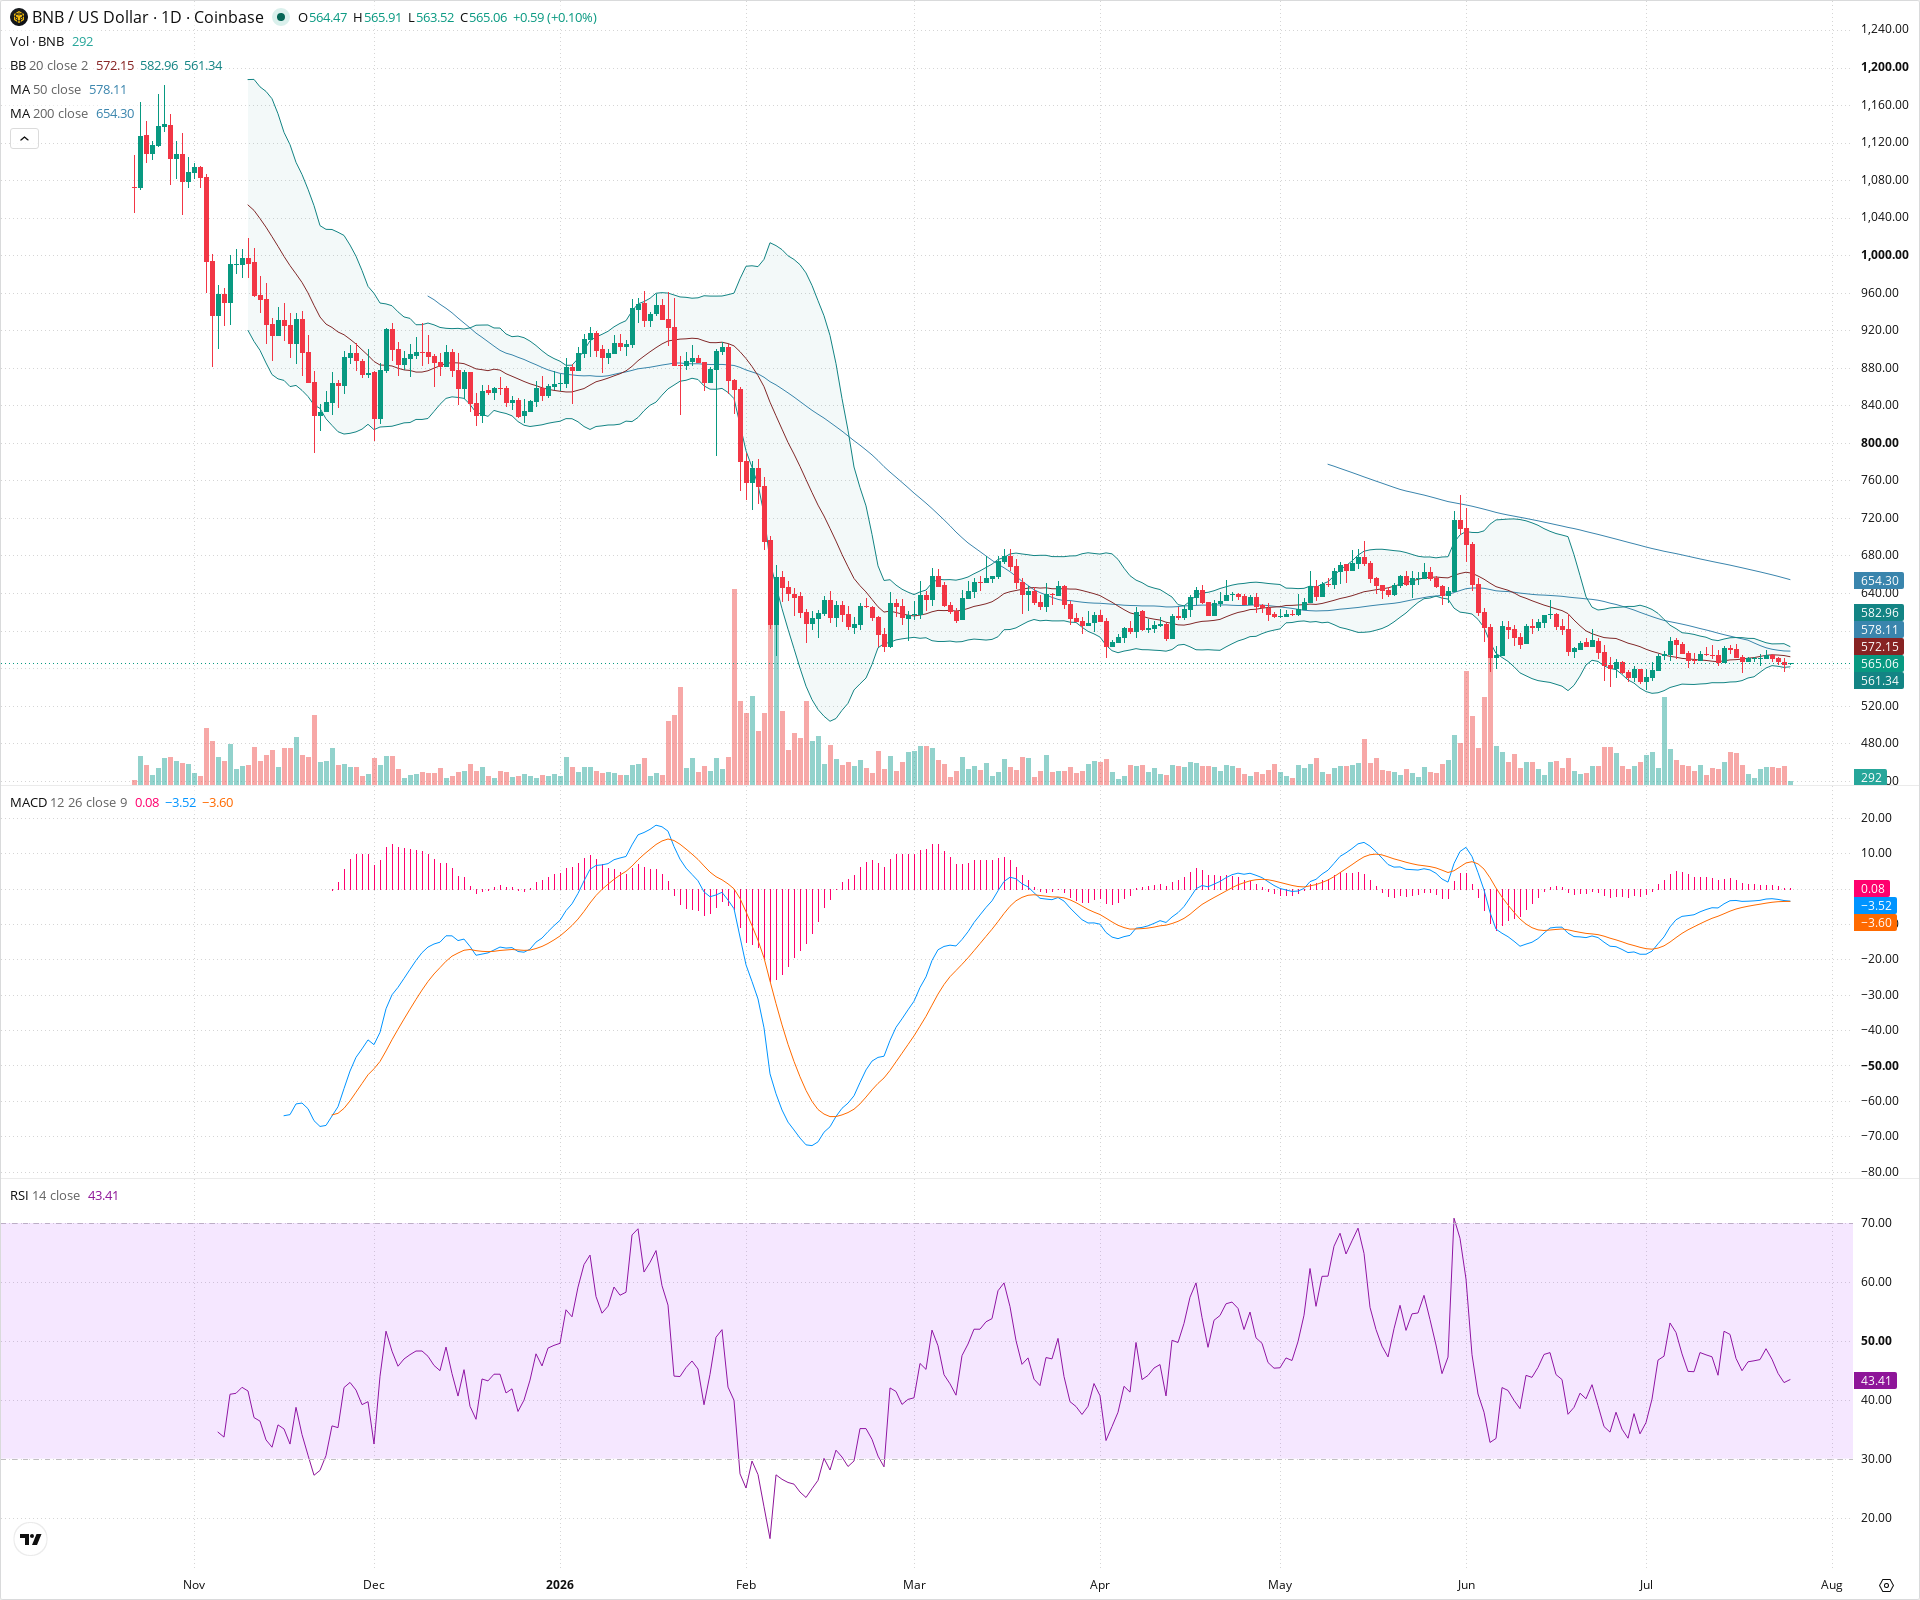
BNB Daily Chart
Sentiment
Short-term Sentiment (days to weeks): Bearish
Price remains below the 20-day and 50-day SMAs, forming a series of lower highs and lower lows. While the MACD histogram shows waning downward momentum, the overall short-term price structure is still negative.
Long-term Sentiment (weeks to months): Bearish
The asset is in a pronounced, multi-month downtrend, trading significantly below a downward-sloping 200-day SMA, indicating sustained long-term selling pressure.
Report Metadata
- Timeframe: daily
- Generated at: 2026-07-25T12:02:37.500Z
- Model: gemini-3.1-pro-preview
Support Price Levels
| Level | Range | Strength | Notes |
|---|---|---|---|
| $557.50 | $550.00 - $565.00 | Weak | Current local support zone aligning with recent swing lows and the lower Bollinger Band. |
| $500.00 | $480.00 - $520.00 | Weak | Previous consolidation area from late February/early March; acts as the next logical downside target if current lows fail. |
Resistance Price Levels
| Level | Range | Strength | Notes |
|---|---|---|---|
| $587.50 | $575.00 - $600.00 | Strong | Immediate overhead resistance zone comprising the 20-day SMA, 50-day SMA, and recent minor swing highs. |
| $665.00 | $650.00 - $680.00 | Strong | Major structural resistance zone where a significant breakdown occurred in early June, also coinciding with the descending 200-day SMA. |
Potential Chart Patterns in Formation
| Strength | Pattern | Signal | Target | Details |
|---|---|---|---|---|
| Weak | Bear Flag / Consolidation | Bearish | N/A | A period of weak, sideways-to-slightly-upward consolidation following a sharp price drop in early June, potentially signaling a pause before further downward continuation. |
| Strong | Descending Channel | Bearish | N/A | The broader price action since March forms a clear descending structure with consistent lower highs, constrained by the 50-day moving average. |
Frequently Asked Questions about BNB
What is the current sentiment for BNB?
The short-term sentiment for BNB is currently Bearish because Price remains below the 20-day and 50-day SMAs, forming a series of lower highs and lower lows. While the MACD histogram shows waning downward momentum, the overall short-term price structure is still negative.. The long-term trend is classified as Bearish.
What are the key support levels for BNB?
StockDips.AI has identified key support levels for BNB at $557.50 and $500.00. These levels may represent potential accumulation zones where buying interest could emerge.
Is BNB in a significant dip or a Value Dip right now?
BNB has a Value Score of 75/100. It is currently flagged as a significant dip in the Top Dips list. It is not listed as a Value Dip because the long-term sentiment or value-score threshold does not qualify.
View the full interactive analysis on StockDips.AI.