SOL Daily Technical Analysis
Solana
High-performance blockchain supporting fast and inexpensive decentralized apps and NFTs.
SOL Technical Analysis Summary
SOL is currently entrenched in a long-term downtrend, capped by a steadfastly declining 200-day SMA. For the past several months, price action has devolved into a choppy, sideways consolidation range with low volume. Short-term momentum indicators suggest a slight bearish tilt, making a test of the lower range support likely before any potential upward breakout can be mounted.
Included In Lists
Related Tickers of Interest
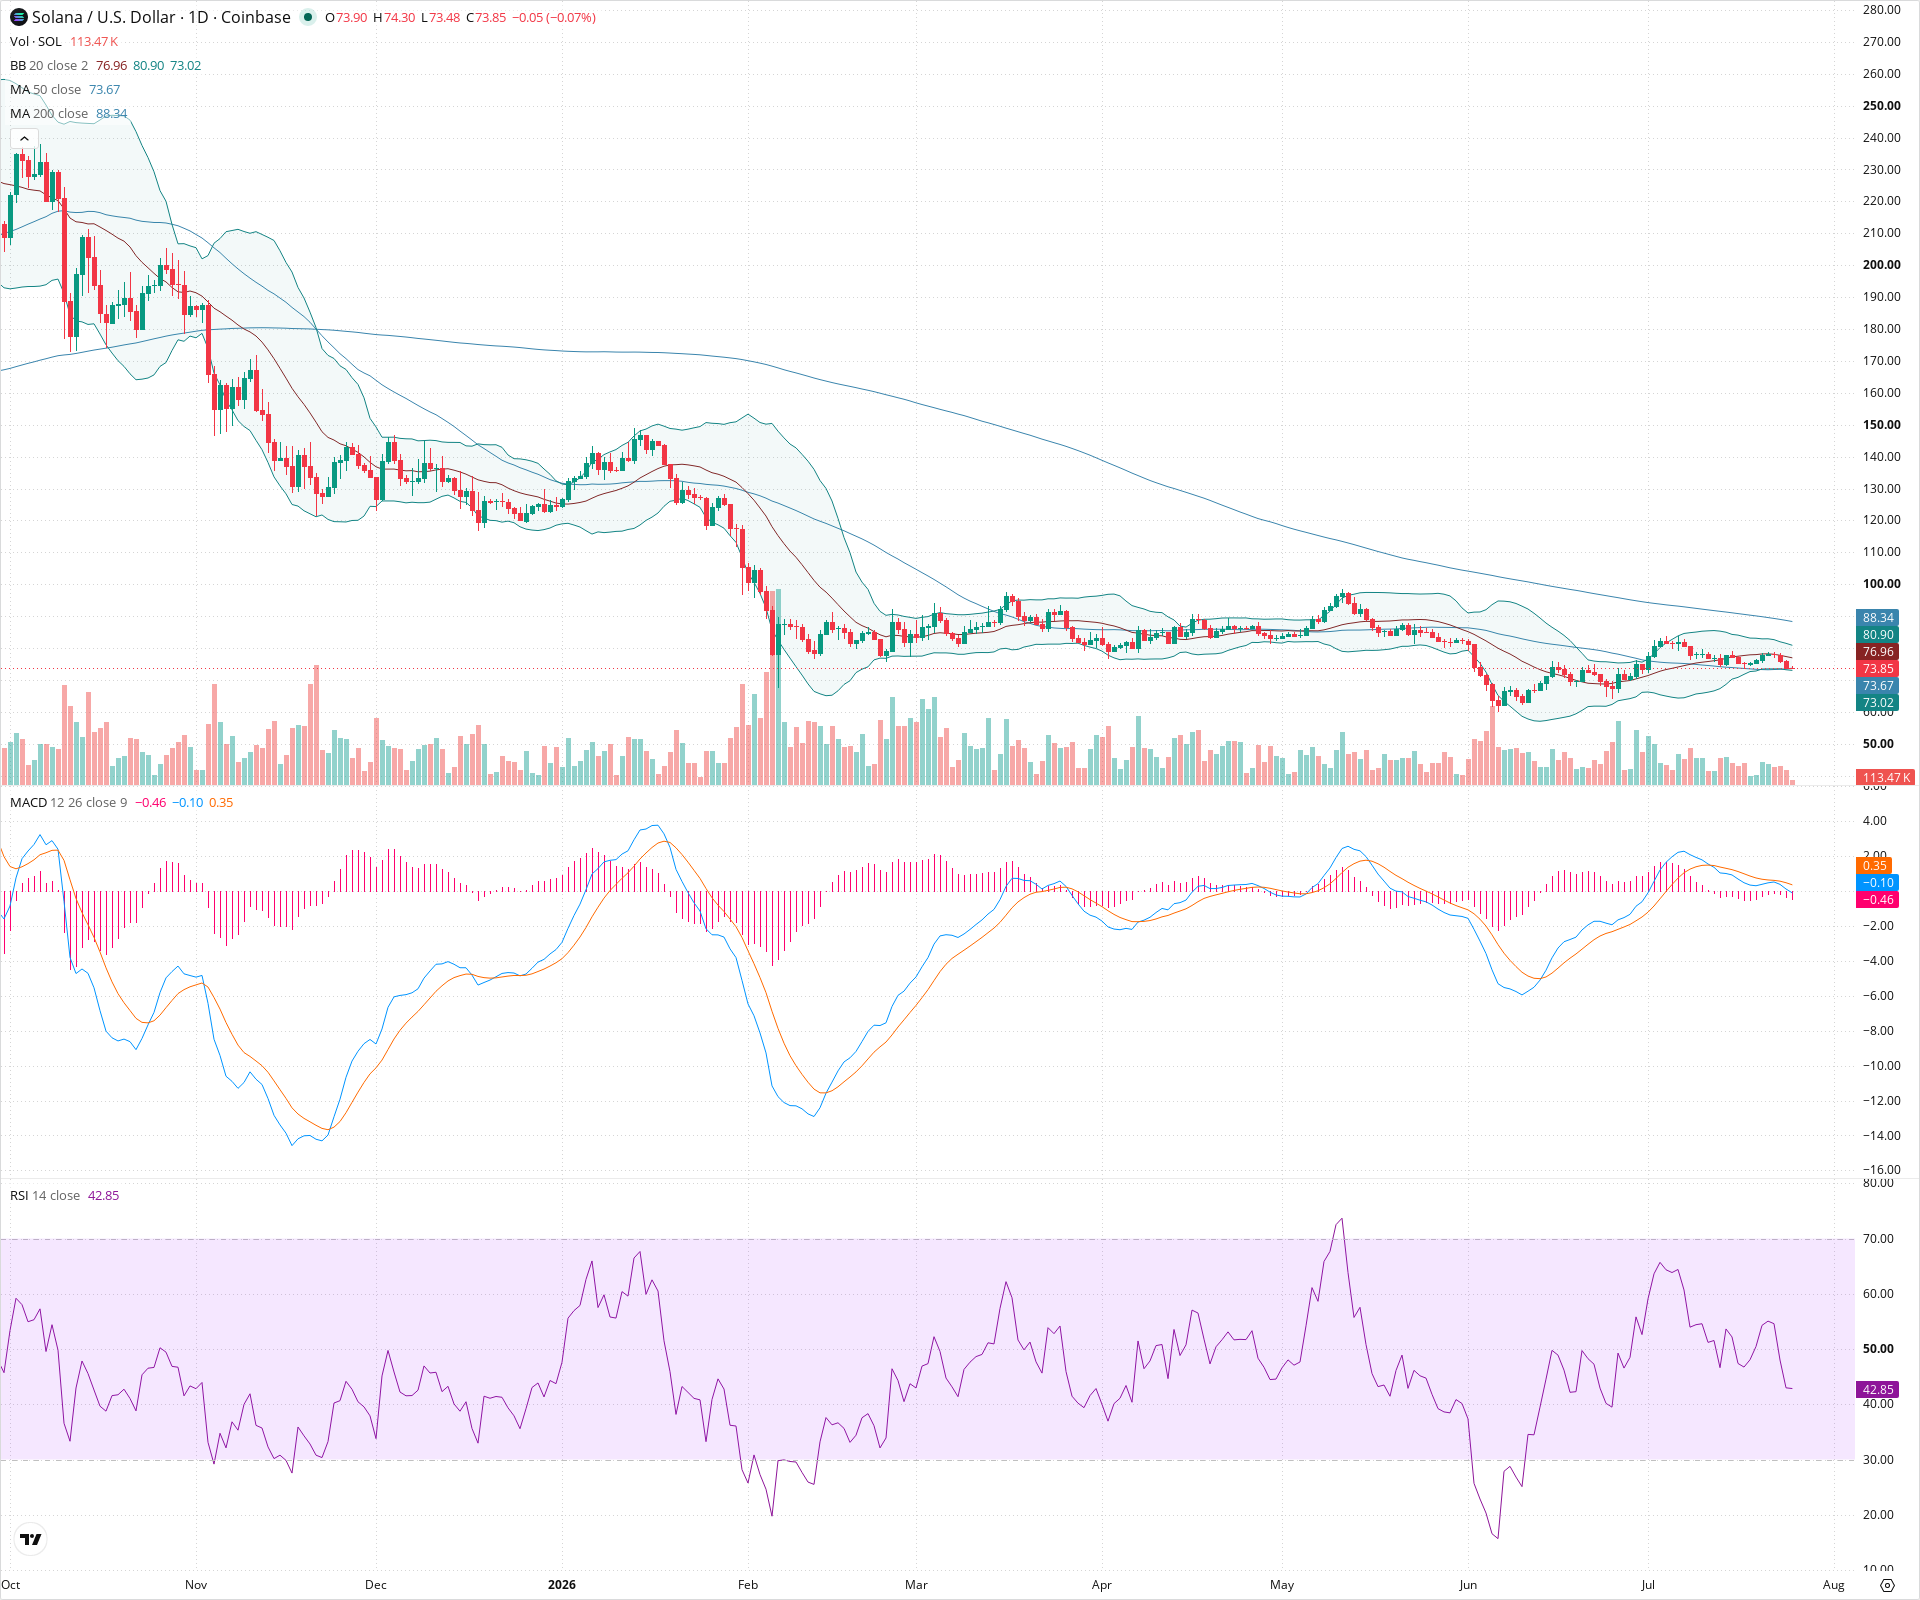
SOL Daily Chart
Sentiment
Short-term Sentiment (days to weeks): Bearish
Price is struggling below the 20-day SMA and is pressing against the 50-day SMA. The MACD has recently crossed bearishly with an expanding negative histogram, and RSI is trending downward below the 50 midline.
Long-term Sentiment (weeks to months): Bearish
The dominant trend remains bearish as the price is trading well below a declining 200-day SMA, following a significant historical sell-off. The current price action resembles a long-term bearish consolidation rather than a reversal.
Report Metadata
- Timeframe: daily
- Generated at: 2026-07-25T12:01:44.500Z
- Model: gemini-3.1-pro-preview
Support Price Levels
| Level | Range | Strength | Notes |
|---|---|---|---|
| $70.00 | $68.00 - $72.00 | Strong | Recent cluster of swing lows acting as the floor of the current localized trading range. |
| $52.50 | $50.00 - $55.00 | Strong | Major structural swing low established earlier in the chart, serving as deep macro support. |
Resistance Price Levels
| Level | Range | Strength | Notes |
|---|---|---|---|
| $81.50 | $80.00 - $83.00 | Strong | Confluence of recent swing highs, the 20-day SMA, and the upper Bollinger Band. |
| $90.00 | $88.00 - $92.00 | Strong | Major dynamic resistance from the declining 200-day SMA, coupled with prior structural resistance zones. |
Potential Chart Patterns in Formation
| Strength | Pattern | Signal | Target | Details |
|---|---|---|---|---|
| Strong | Sideways Consolidation Range | Neutral | N/A | Following a steep downtrend, the price has been moving sideways for several months between roughly $68 and $90, forming a rectangular base without clear directional breakout conviction. |
Frequently Asked Questions about SOL
What is the current sentiment for SOL?
The short-term sentiment for SOL is currently Bearish because Price is struggling below the 20-day SMA and is pressing against the 50-day SMA. The MACD has recently crossed bearishly with an expanding negative histogram, and RSI is trending downward below the 50 midline.. The long-term trend is classified as Bearish.
What are the key support levels for SOL?
StockDips.AI has identified key support levels for SOL at $70.00 and $52.50. These levels may represent potential accumulation zones where buying interest could emerge.
Is SOL in a significant dip or a Value Dip right now?
SOL has a Value Score of 67/100. It is not currently flagged as a significant dip in the Top Dips list. It is not listed as a Value Dip because the long-term sentiment or value-score threshold does not qualify.
View the full interactive analysis on StockDips.AI.