CVX Monthly Technical Analysis
Chevron Corporation
Integrated energy and chemical company
CVX Technical Analysis Summary
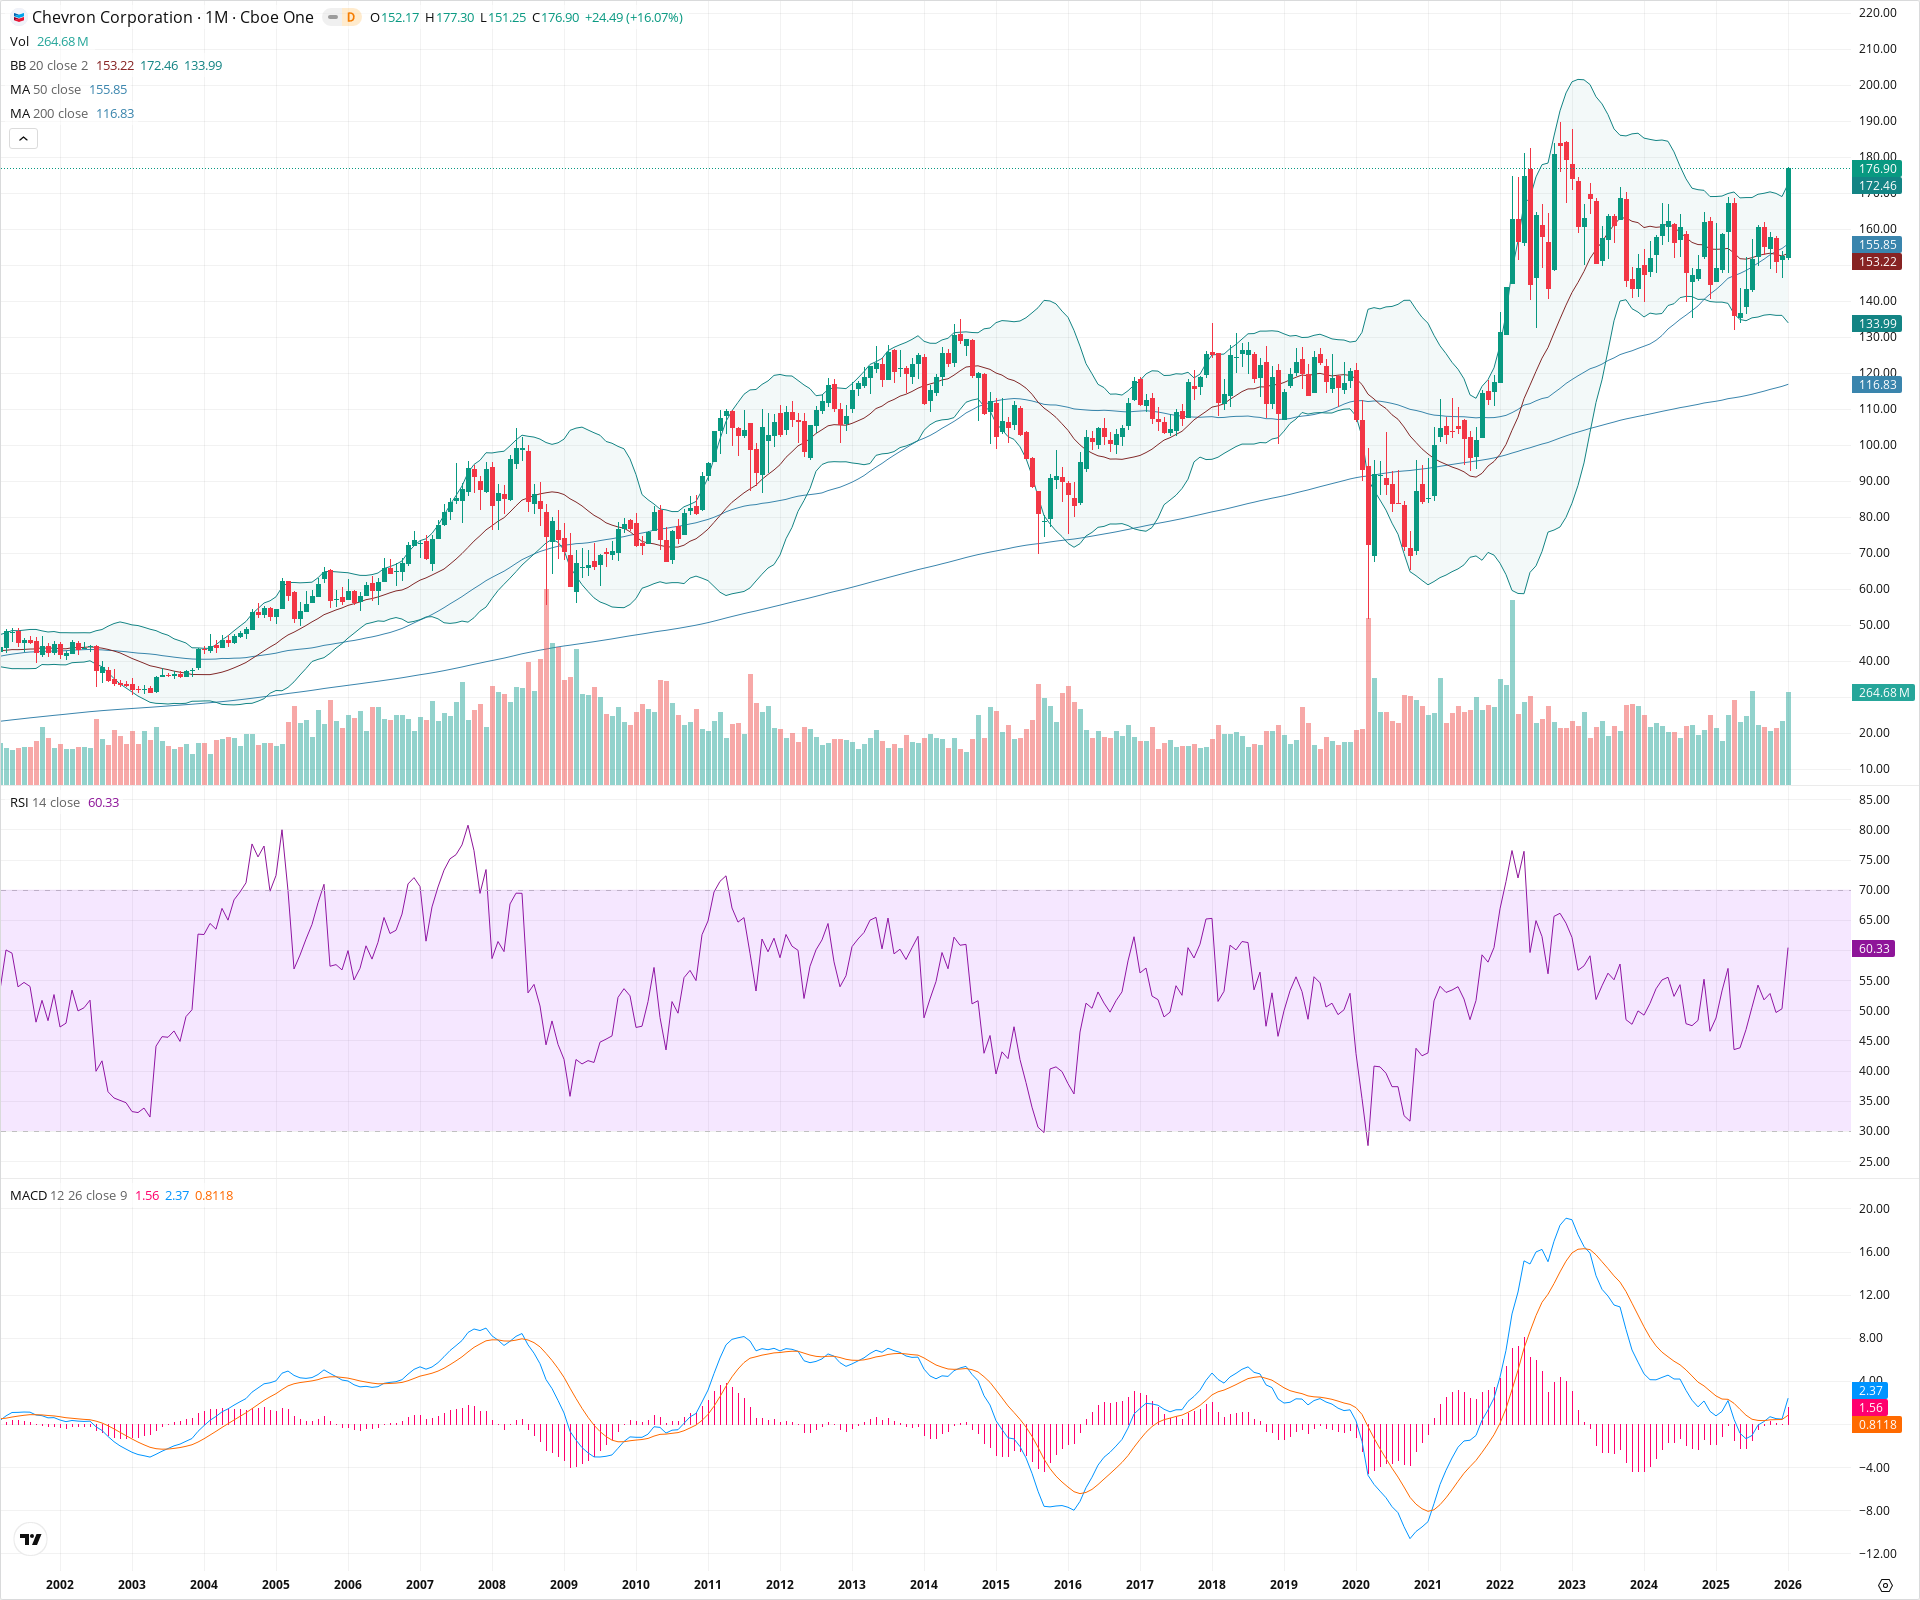
Chevron is exhibiting strong technical resilience within a long-term bull market, evidenced by the price holding firmly above the 200-month moving average. After a multi-year period of consolidation, the current monthly candle shows a forceful breakout attempt above the 50-month SMA and upper Bollinger Band. The price is now poised to test the upper boundary of its trading range near historical highs.
Included In Lists
Related Tickers of Interest
CVX Monthly Chart
Sentiment
Short-term Sentiment (days to weeks): Bullish
Price has surged roughly 16% this month, breaking decisively above the 50-month SMA and piercing the upper Bollinger Band, indicating a resumption of strong upward momentum.
Long-term Sentiment (weeks to months): Bullish
The stock remains in a clear secular uptrend, trading well above a rising 200-month SMA. The RSI is holding above 60, consistent with a strong bullish regime.
Report Metadata
- Timeframe: monthly
- Generated at: 2026-02-02T05:31:26.532Z
- Model: gemini-3-pro-preview
Support Price Levels
| Level | Range | Strength | Notes |
|---|---|---|---|
| $154.54 | $153.22 - $155.85 | Strong | Confluence zone of the Bollinger Band basis (20 SMA) and the 50-month SMA. |
| $137.00 | $133.99 - $140.00 | Strong | Major structural support defined by the lower Bollinger Band and the bottom of the multi-year consolidation range. |
Resistance Price Levels
| Level | Range | Strength | Notes |
|---|---|---|---|
| $187.50 | $185.00 - $190.00 | Strong | Historical all-time high zone established during the 2022-2023 peaks. |
Potential Chart Patterns in Formation
| Strength | Pattern | Signal | Target | Details |
|---|---|---|---|---|
| Strong | High-Level Consolidation (Rectangle) | Bullish | N/A | Price has been oscillating in a broad range between ~140 and ~190 since mid-2022, digesting the prior rally. |
Frequently Asked Questions about CVX
What is the current sentiment for CVX?
The short-term sentiment for CVX is currently Bullish because Price has surged roughly 16% this month, breaking decisively above the 50-month SMA and piercing the upper Bollinger Band, indicating a resumption of strong upward momentum.. The long-term trend is classified as Bullish.
What are the key support levels for CVX?
StockDips.AI has identified key support levels for CVX at $154.54 and $137.00. These levels may represent potential accumulation zones where buying interest could emerge.
Is CVX in a significant dip or a Value Dip right now?
CVX has a Value Score of 30/100. It is not currently flagged as a significant dip in the Top Dips list. It is not listed as a Value Dip because the long-term sentiment or value-score threshold does not qualify.
View the full interactive analysis on StockDips.AI.