GME Daily Technical Analysis
GameStop Corp.
Video game retailer that became a meme stock with significant retail following.
GME Technical Analysis Summary
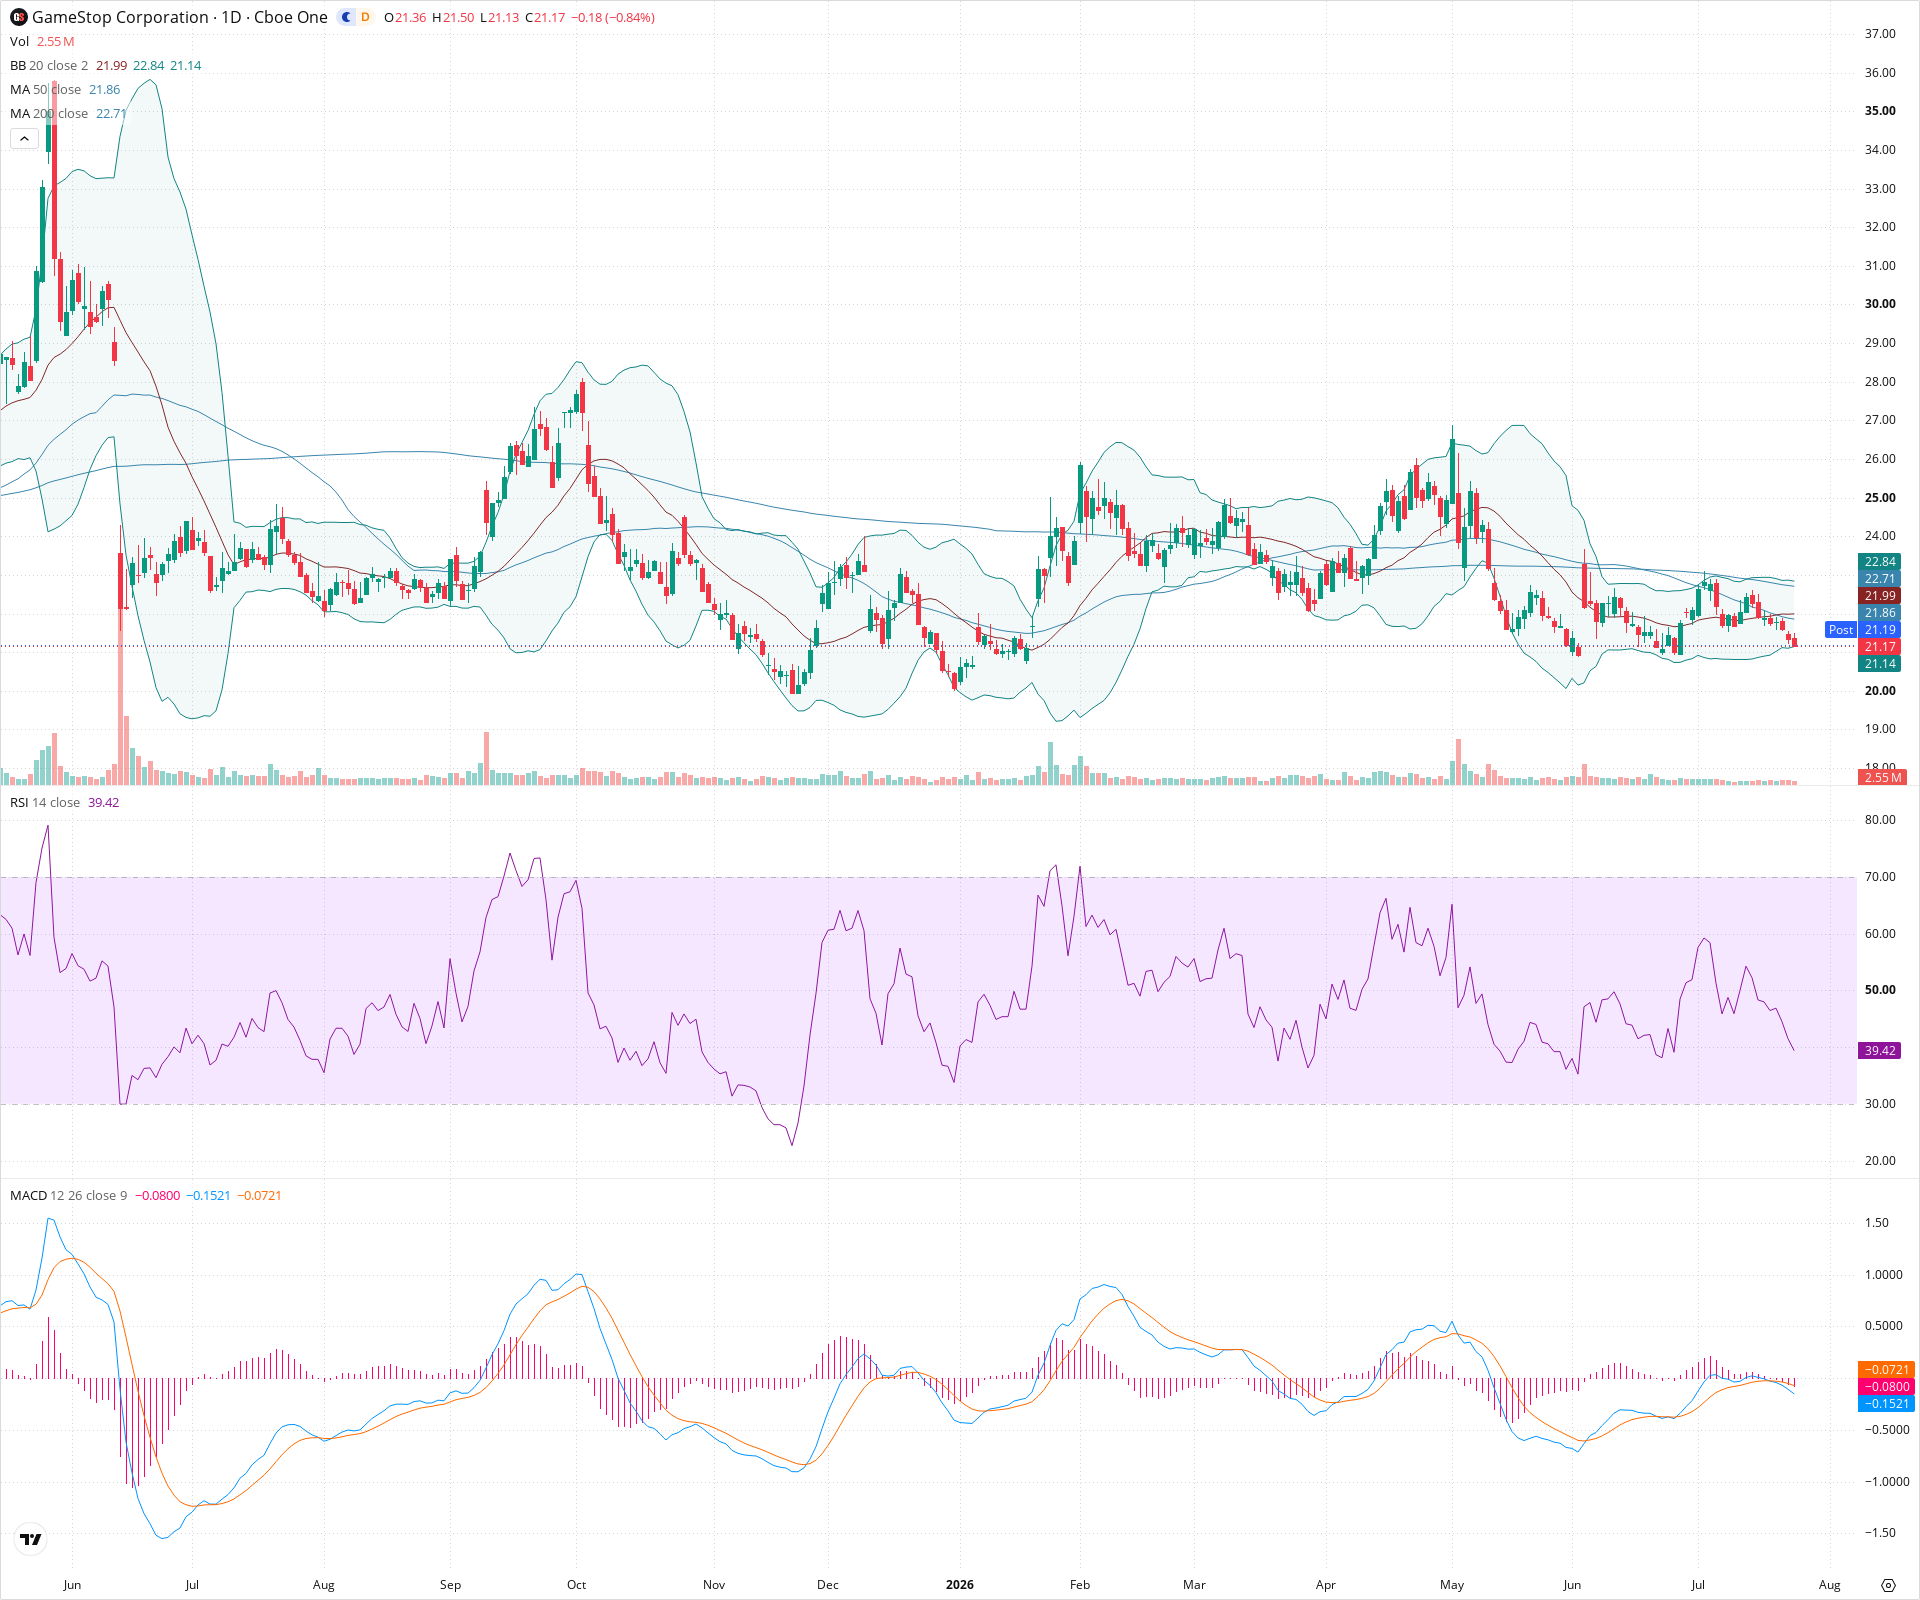
GME exhibits significant technical weakness on the daily chart, having fallen below all key moving averages (20, 50, and 200-day SMAs). Short-term momentum indicators like RSI and MACD confirm the current downward pressure, suggesting sellers are in control. For long-term investors, the inability to hold above the 200-day SMA indicates a lack of structural strength, making a retest of the lower support zones around $20 or lower a distinct possibility before any potential reversal.
Included In Lists
Related Tickers of Interest
GME Daily Chart
Sentiment
Short-term Sentiment (days to weeks): Bearish
Price is currently trending downward, riding the lower Bollinger Band, and is positioned below the 20, 50, and 200-day SMAs. RSI is falling below 40, and MACD shows negative momentum with the MACD line below the signal line.
Long-term Sentiment (weeks to months): Bearish
The broader trend is a wide, choppy range, but recent price action has failed to sustain a rally above the 200-day SMA. All major moving averages (20, 50, 200) are currently above the price, indicating a lack of long-term bullish control.
Report Metadata
- Timeframe: daily
- Generated at: 2026-07-24T21:07:28.723Z
- Model: gemini-3.1-pro-preview
Support Price Levels
| Level | Range | Strength | Notes |
|---|---|---|---|
| $20.50 | $20.00 - $21.00 | Strong | Psychological whole number level and significant consolidation zone from early in the year (Jan/Feb). |
| $19.15 | $18.80 - $19.50 | Strong | Major swing low area established in late Q4 of the previous year. |
Resistance Price Levels
| Level | Range | Strength | Notes |
|---|---|---|---|
| $22.30 | $21.80 - $22.80 | Strong | Immediate overhead resistance zone defined by the convergence of the 20-day, 50-day, and 200-day SMAs. |
| $25.00 | $24.50 - $25.50 | Strong | Recent swing high zone from the May rally. |
Potential Chart Patterns in Formation
| Strength | Pattern | Signal | Target | Details |
|---|---|---|---|---|
| Strong | Downtrend Channel | Bearish | $20.50 | Since the peak in late May, price has established a clear pattern of lower highs and lower lows, currently pressing against the lower boundary of this short-term descending channel. |
Frequently Asked Questions about GME
What is the current sentiment for GME?
The short-term sentiment for GME is currently Bearish because Price is currently trending downward, riding the lower Bollinger Band, and is positioned below the 20, 50, and 200-day SMAs. RSI is falling below 40, and MACD shows negative momentum with the MACD line below the signal line.. The long-term trend is classified as Bearish.
What are the key support levels for GME?
StockDips.AI has identified key support levels for GME at $20.50 and $19.15. These levels may represent potential accumulation zones where buying interest could emerge.
Is GME in a significant dip or a Value Dip right now?
GME has a Value Score of 62/100. It is not currently flagged as a significant dip in the Top Dips list. It is not listed as a Value Dip because the long-term sentiment or value-score threshold does not qualify.
View the full interactive analysis on StockDips.AI.