GME Monthly Technical Analysis
GameStop Corp.
Video game retailer that became a meme stock with significant retail following.
GME Technical Analysis Summary
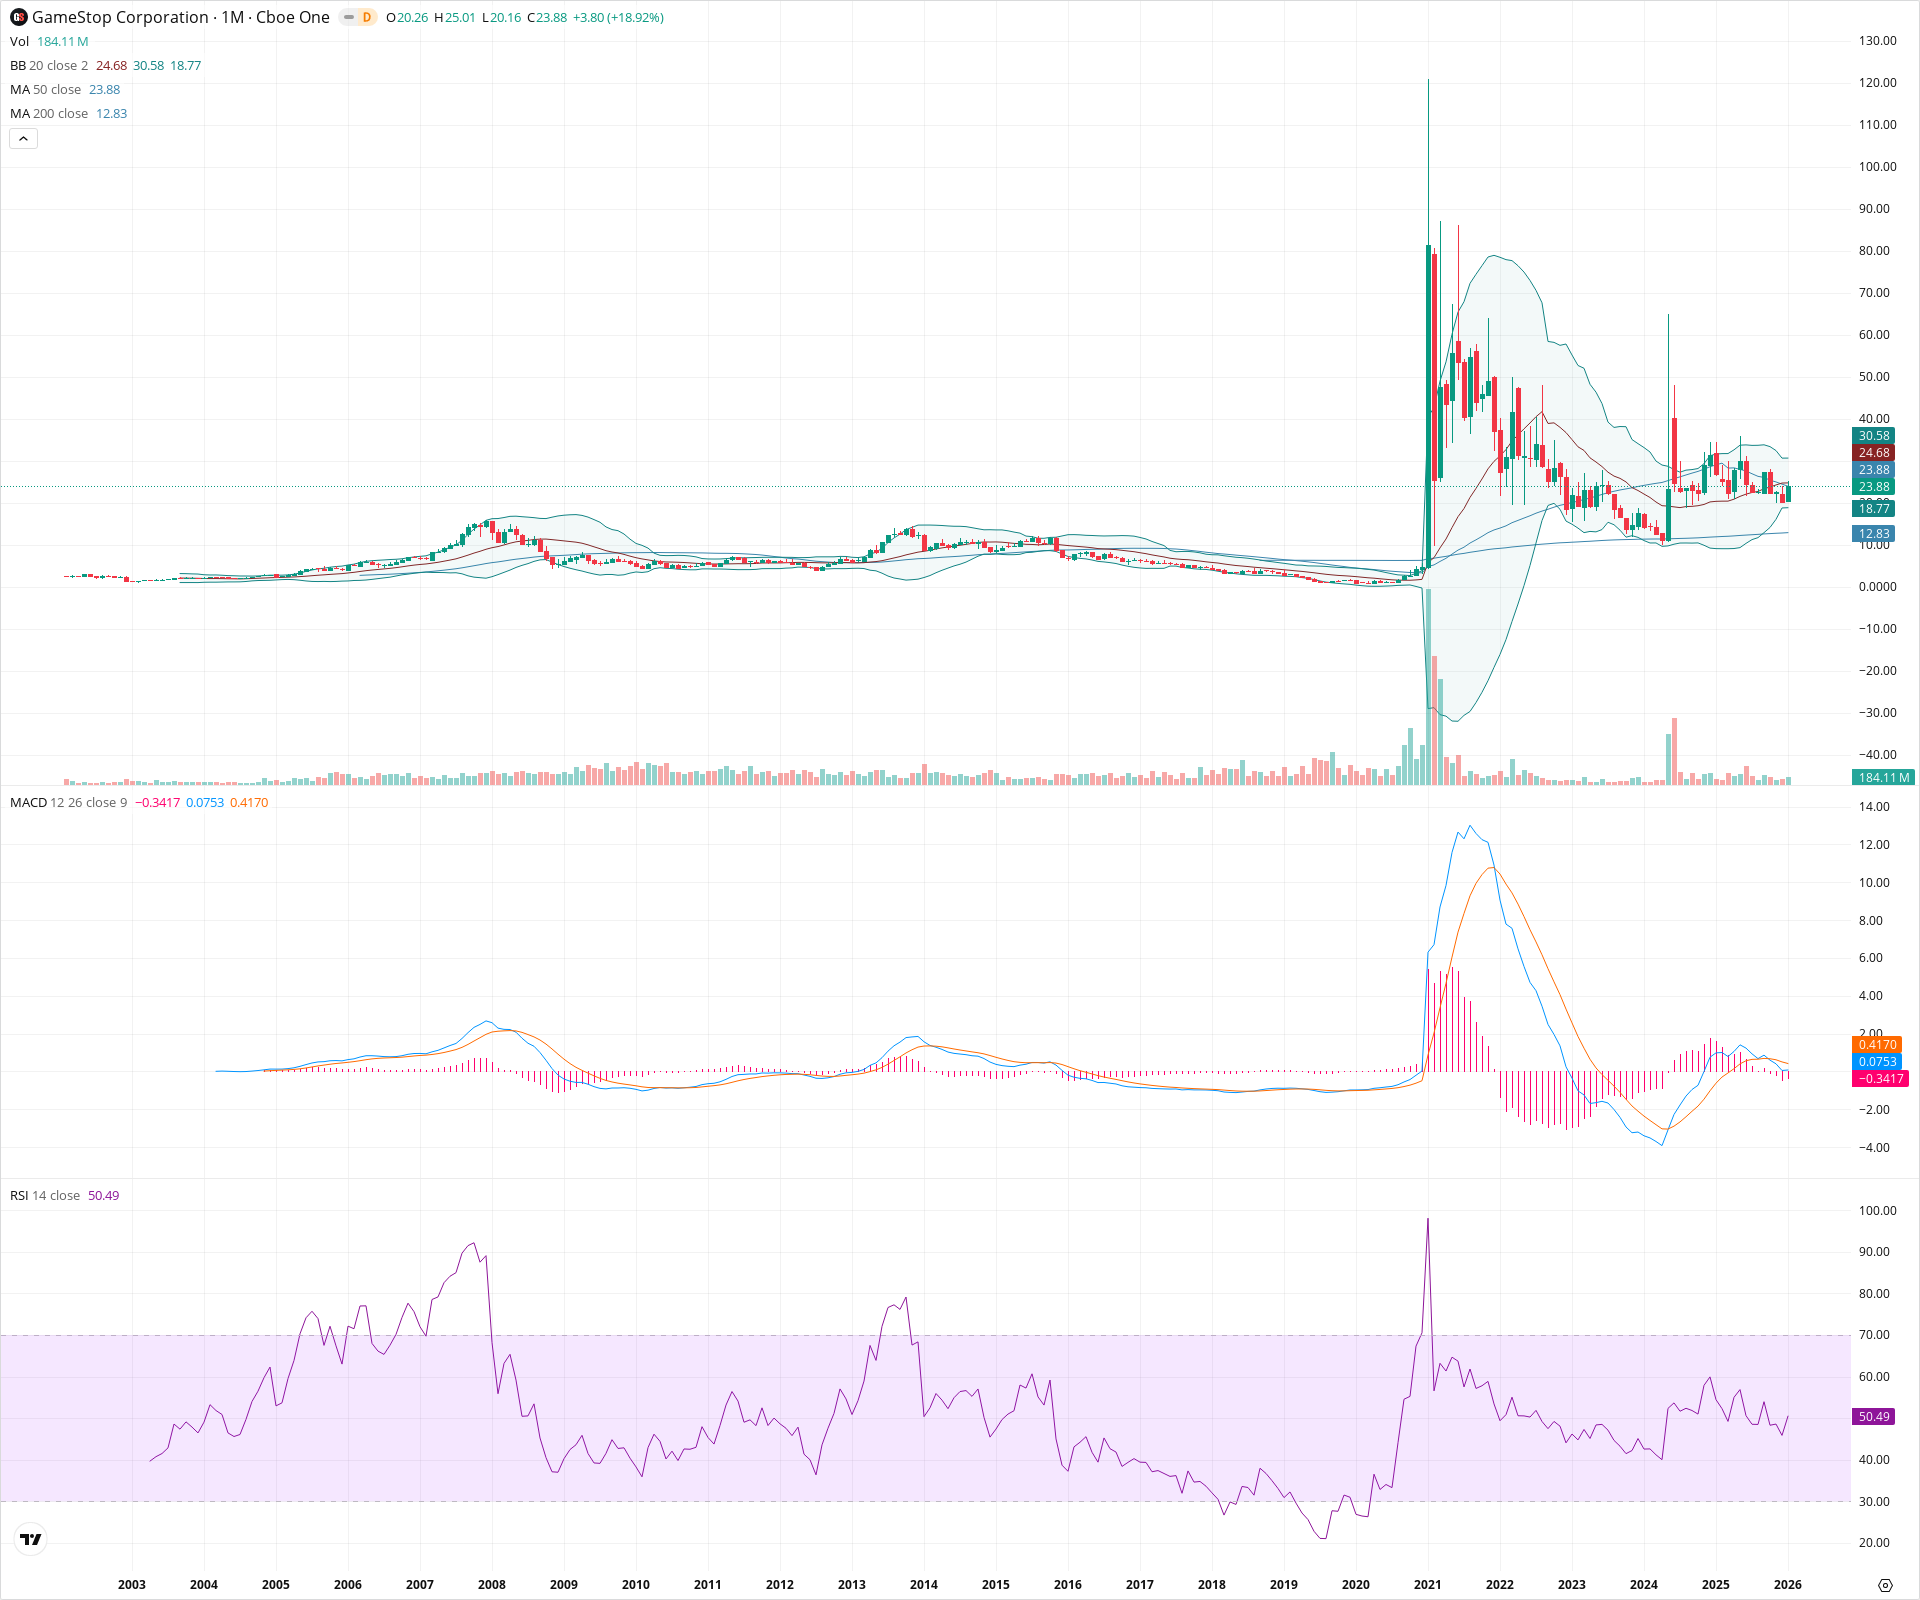
GameStop is currently trading within a defined secular consolidation pattern, finding reliable long-term support at the 200-month moving average while facing resistance at the 20 and 50-month averages. Momentum indicators like the RSI and MACD have reset to neutral levels, indicating a pause in secular trend direction and a period of equilibrium. A sustained monthly close above the 24.68 level would be required to shift the long-term bias from neutral to bullish.
Included In Lists
Related Tickers of Interest
GME Monthly Chart
Sentiment
Short-term Sentiment (days to weeks): Bullish
The current monthly candle shows strong momentum (+18.92%), rebounding from local support around 20.00 and testing the 50-month moving average.
Long-term Sentiment (weeks to months): Neutral
The stock is in a multi-year consolidation phase following the 2021 volatility, characterized by a flattening MACD near the zero line and an RSI near 50.
Report Metadata
- Timeframe: monthly
- Generated at: 2026-02-02T06:23:19.313Z
- Model: gemini-3-pro-preview
Support Price Levels
| Level | Range | Strength | Notes |
|---|---|---|---|
| $18.50 | $17.00 - $20.00 | Strong | Recent structural support zone and consolidation floor. |
| $11.42 | $10.00 - $12.83 | Strong | Major secular floor defined by the 200-month SMA (12.83) and historical lows from 2023-2024. |
Resistance Price Levels
| Level | Range | Strength | Notes |
|---|---|---|---|
| $24.28 | $23.88 - $24.68 | Weak | Immediate technical confluence of the 50-month SMA (23.88) and the 20-month BB basis (24.68). |
| $42.50 | $40.00 - $45.00 | Strong | Upper boundary of the multi-year trading range and cluster of previous candle bodies. |
| $70.00 | $60.00 - $80.00 | Strong | Significant overhead supply from the extensive upper wicks seen in the mid-2024 volatility spike. |
Potential Chart Patterns in Formation
| Strength | Pattern | Signal | Target | Details |
|---|---|---|---|---|
| Strong | Secular Base / Consolidation | Neutral | N/A | Price has stabilized into a wide sideways range after a major correction, holding above the 200-month SMA to form a potential accumulation structure. |
Frequently Asked Questions about GME
What is the current sentiment for GME?
The short-term sentiment for GME is currently Bullish because The current monthly candle shows strong momentum (+18.92%), rebounding from local support around 20.00 and testing the 50-month moving average.. The long-term trend is classified as Neutral.
What are the key support levels for GME?
StockDips.AI has identified key support levels for GME at $18.50 and $11.42. These levels may represent potential accumulation zones where buying interest could emerge.
Is GME in a significant dip or a Value Dip right now?
GME has a Value Score of 63/100. It is not currently flagged as a significant dip in the Top Dips list. It is not listed as a Value Dip because the long-term sentiment or value-score threshold does not qualify.
View the full interactive analysis on StockDips.AI.