JPM Weekly Technical Analysis
JPMorgan Chase & Co.
Largest U.S. bank providing consumer, corporate, and investment banking services.
JPM Technical Analysis Summary
JPM is exhibiting strong bullish price action on the weekly timeframe, remaining firmly embedded within a long-term secular uptrend. The recent breakout above the multi-month consolidation zone, coupled with a fresh bullish MACD crossover, suggests the upward trajectory is resuming. While short-term momentum is robust, investors should monitor the RSI as it nears overbought levels, though structural support below remains very strong.
Included In Lists
Related Tickers of Interest
JPM Weekly Chart
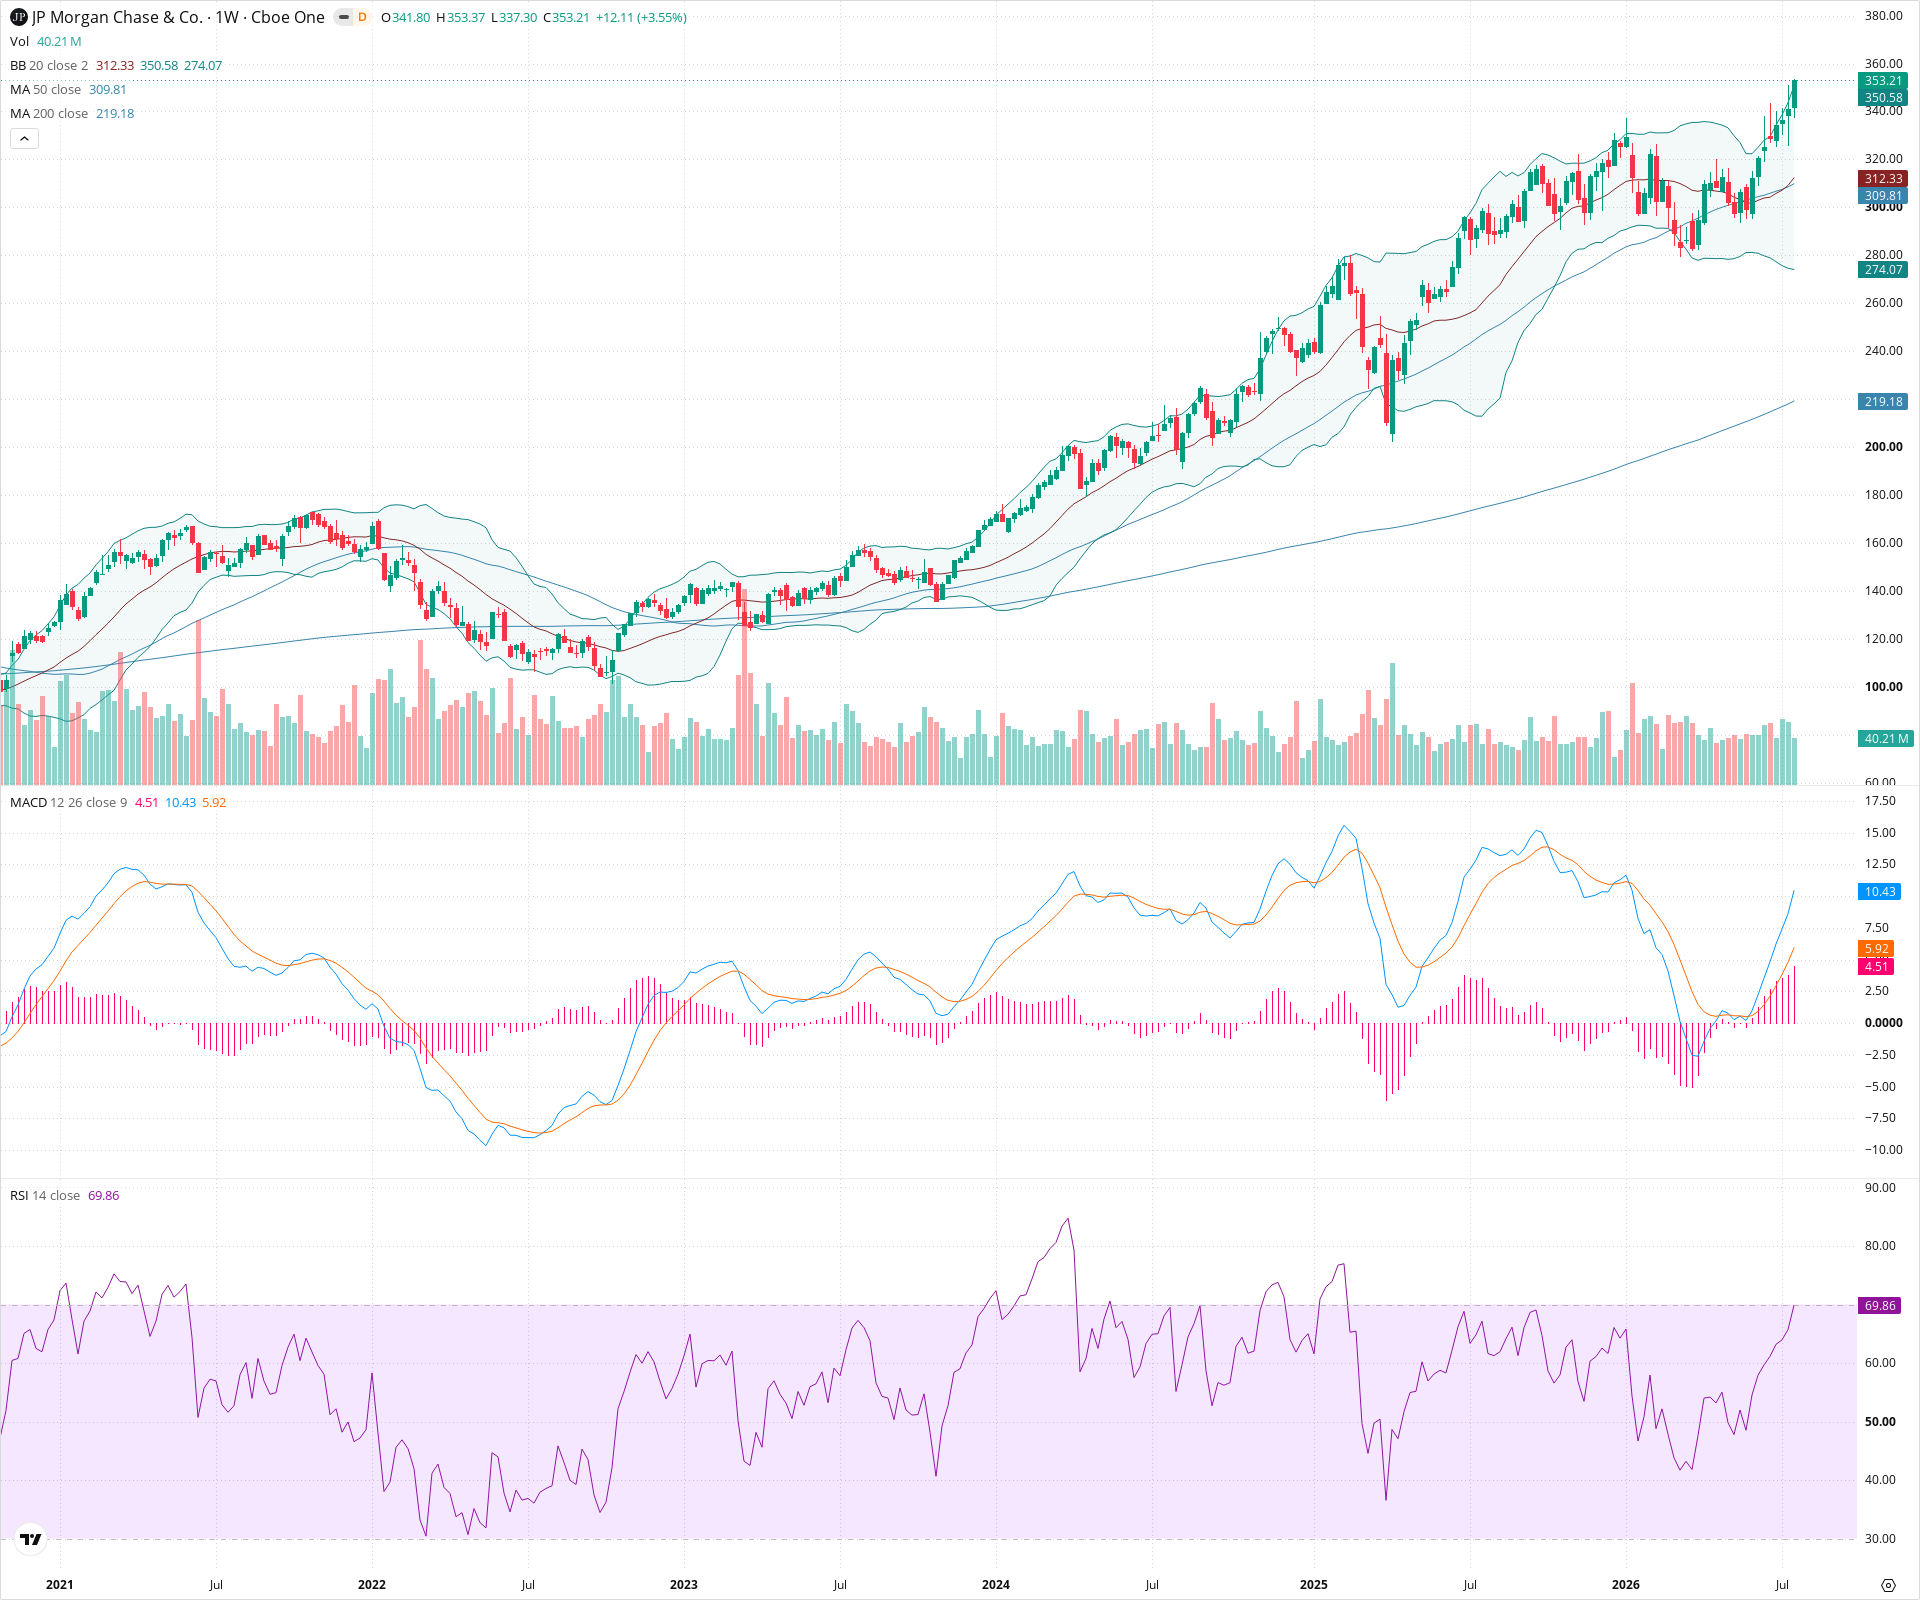
Sentiment
Short-term Sentiment (days to weeks): Bullish
Price has recently broken out of a multi-month consolidation pattern to new highs, supported by a bullish MACD crossover and strong upward momentum, although RSI is approaching the overbought 70 level.
Long-term Sentiment (weeks to months): Bullish
The stock is in a persistent, multi-year uptrend with the price comfortably above rising 20, 50, and 200-week SMAs, establishing consistent higher highs and higher lows.
Report Metadata
- Timeframe: weekly
- Generated at: 2026-07-25T09:03:11.199Z
- Model: gemini-3.1-pro-preview
Support Price Levels
| Level | Range | Strength | Notes |
|---|---|---|---|
| $302.50 | $290.00 - $315.00 | Strong | Recent multi-month consolidation zone which now acts as a strong support base, further reinforced by the confluence of the rising 20-week and 50-week SMAs in this area. |
| $240.00 | $230.00 - $250.00 | Strong | Major prior structural swing low and consolidation area before the current prolonged leg up. |
Resistance Price Levels
| Level | Range | Strength | Notes |
|---|---|---|---|
| $362.50 | $355.00 - $370.00 | Weak | Price is currently at new highs (price discovery). Near-term resistance is largely psychological or related to upper Bollinger Band extensions rather than historical price structure. |
Potential Chart Patterns in Formation
| Strength | Pattern | Signal | Target | Details |
|---|---|---|---|---|
| Strong | Bullish Continuation Breakout | Bullish | N/A | After a period of sideways consolidation roughly between 270 and 320, the price has broken out to the upside, signaling a continuation of the primary long-term uptrend. |
Frequently Asked Questions about JPM
What is the current sentiment for JPM?
The short-term sentiment for JPM is currently Bullish because Price has recently broken out of a multi-month consolidation pattern to new highs, supported by a bullish MACD crossover and strong upward momentum, although RSI is approaching the overbought 70 level.. The long-term trend is classified as Bullish.
What are the key support levels for JPM?
StockDips.AI has identified key support levels for JPM at $302.50 and $240.00. These levels may represent potential accumulation zones where buying interest could emerge.
Is JPM in a significant dip or a Value Dip right now?
JPM has a Value Score of 24/100. It is not currently flagged as a significant dip in the Top Dips list. It is not listed as a Value Dip because the long-term sentiment or value-score threshold does not qualify.
View the full interactive analysis on StockDips.AI.