JPM Monthly Technical Analysis
JPMorgan Chase & Co.
Largest U.S. bank providing consumer, corporate, and investment banking services.
JPM Technical Analysis Summary
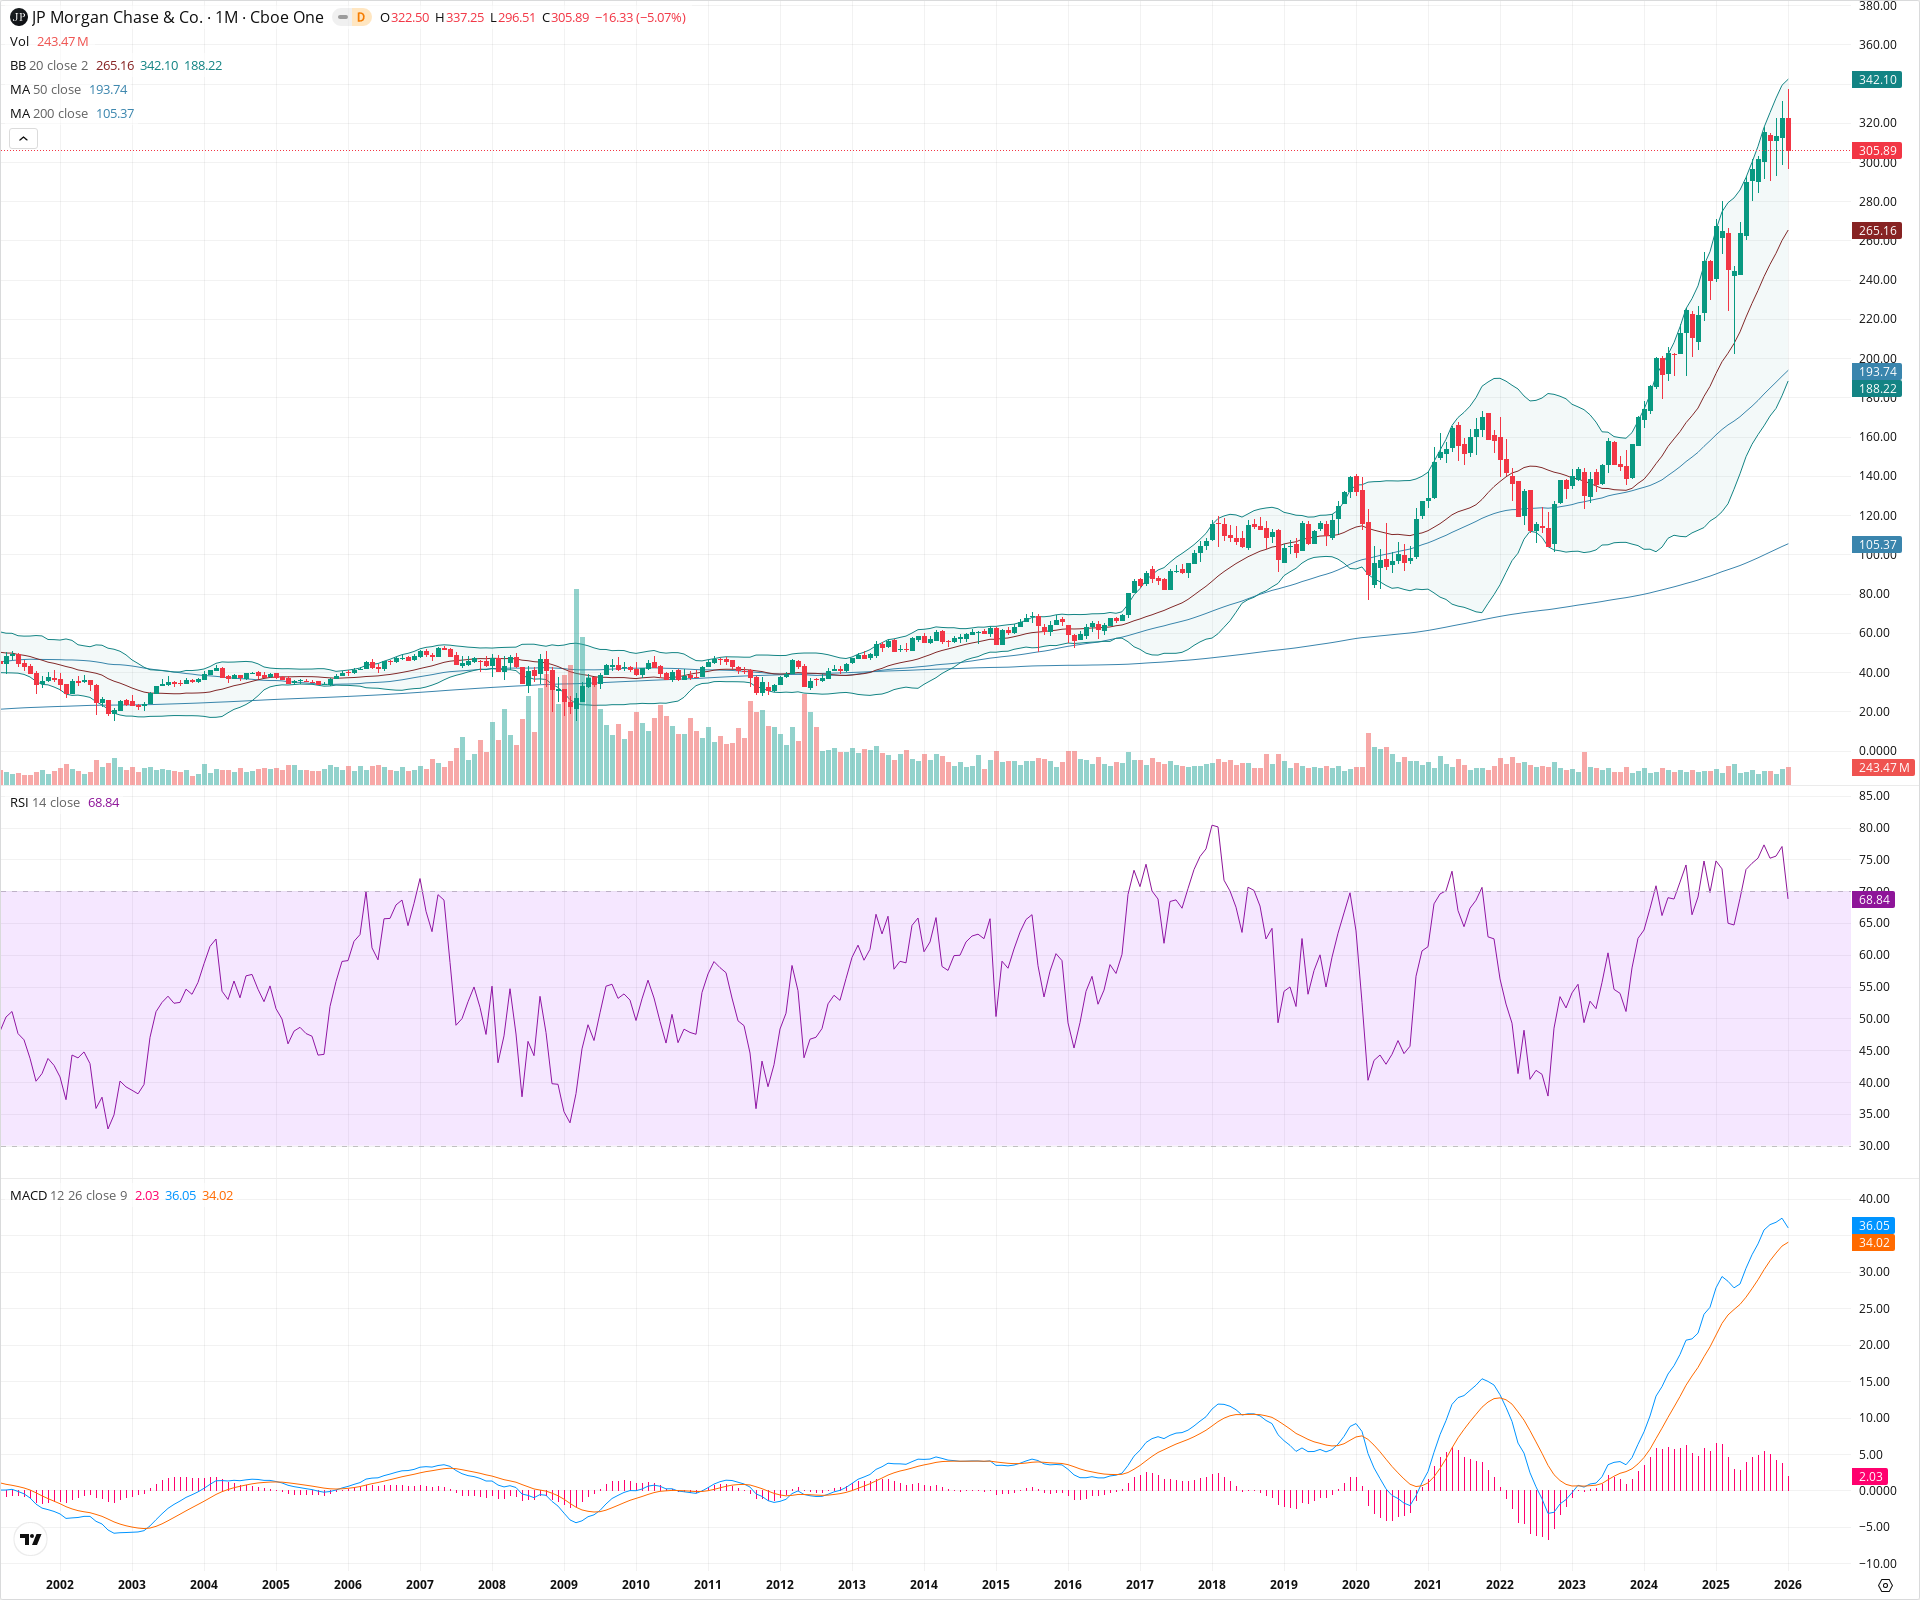
JPM is exhibiting a powerful secular bull trend, characterized by a vertical expansion from the 2023 breakout zone. The price is currently consolidating slightly after hitting new all-time highs, with momentum indicators like the RSI and MACD remaining in strongly bullish territory. Long-term support is well-established at the rising 20-month SMA, and the broader structure suggests continuation despite potential short-term volatility near the upper Bollinger Band.
Included In Lists
Related Tickers of Interest
JPM Monthly Chart
Sentiment
Short-term Sentiment (days to weeks): Bullish
Despite the current month's pullback (-5.07%), the price remains in a steep uptrend well above the 20-month SMA, riding the upper Bollinger Band area.
Long-term Sentiment (weeks to months): Bullish
The stock is in a robust secular uptrend, trading significantly above rising 50 and 200-period SMAs, with MACD confirming strong positive momentum.
Report Metadata
- Timeframe: monthly
- Generated at: 2026-02-02T06:25:12.912Z
- Model: gemini-3-pro-preview
Support Price Levels
| Level | Range | Strength | Notes |
|---|---|---|---|
| $265.16 | $265.16 - $265.16 | Strong | Aligns with the 20-month SMA (Bollinger Band midline) which serves as the primary dynamic trend support. |
| $175.00 | $170.00 - $180.00 | Strong | Major structural breakout zone from the 2021-2022 highs, now acting as deep secular support. |
Resistance Price Levels
| Level | Range | Strength | Notes |
|---|---|---|---|
| $339.68 | $337.25 - $342.10 | Strong | Zone defined by the recent all-time high wick and the upper Bollinger Band. |
Potential Chart Patterns in Formation
| Strength | Pattern | Signal | Target | Details |
|---|---|---|---|---|
| Strong | Secular Breakout | Bullish | N/A | Price broke out of a multi-year consolidation phase (2021-2023) roughly around the 170 level and entered a parabolic expansion phase. |
Frequently Asked Questions about JPM
What is the current sentiment for JPM?
The short-term sentiment for JPM is currently Bullish because Despite the current month's pullback (-5.07%), the price remains in a steep uptrend well above the 20-month SMA, riding the upper Bollinger Band area.. The long-term trend is classified as Bullish.
What are the key support levels for JPM?
StockDips.AI has identified key support levels for JPM at $265.16 and $175.00. These levels may represent potential accumulation zones where buying interest could emerge.
Is JPM in a significant dip or a Value Dip right now?
JPM has a Value Score of 24/100. It is not currently flagged as a significant dip in the Top Dips list. It is not listed as a Value Dip because the long-term sentiment or value-score threshold does not qualify.
View the full interactive analysis on StockDips.AI.