LNG Monthly Technical Analysis
Cheniere Energy, Inc.
Leading U.S. LNG exporter operating major liquefaction facilities supplying natural gas to Europe and Asia.
LNG Technical Analysis Summary
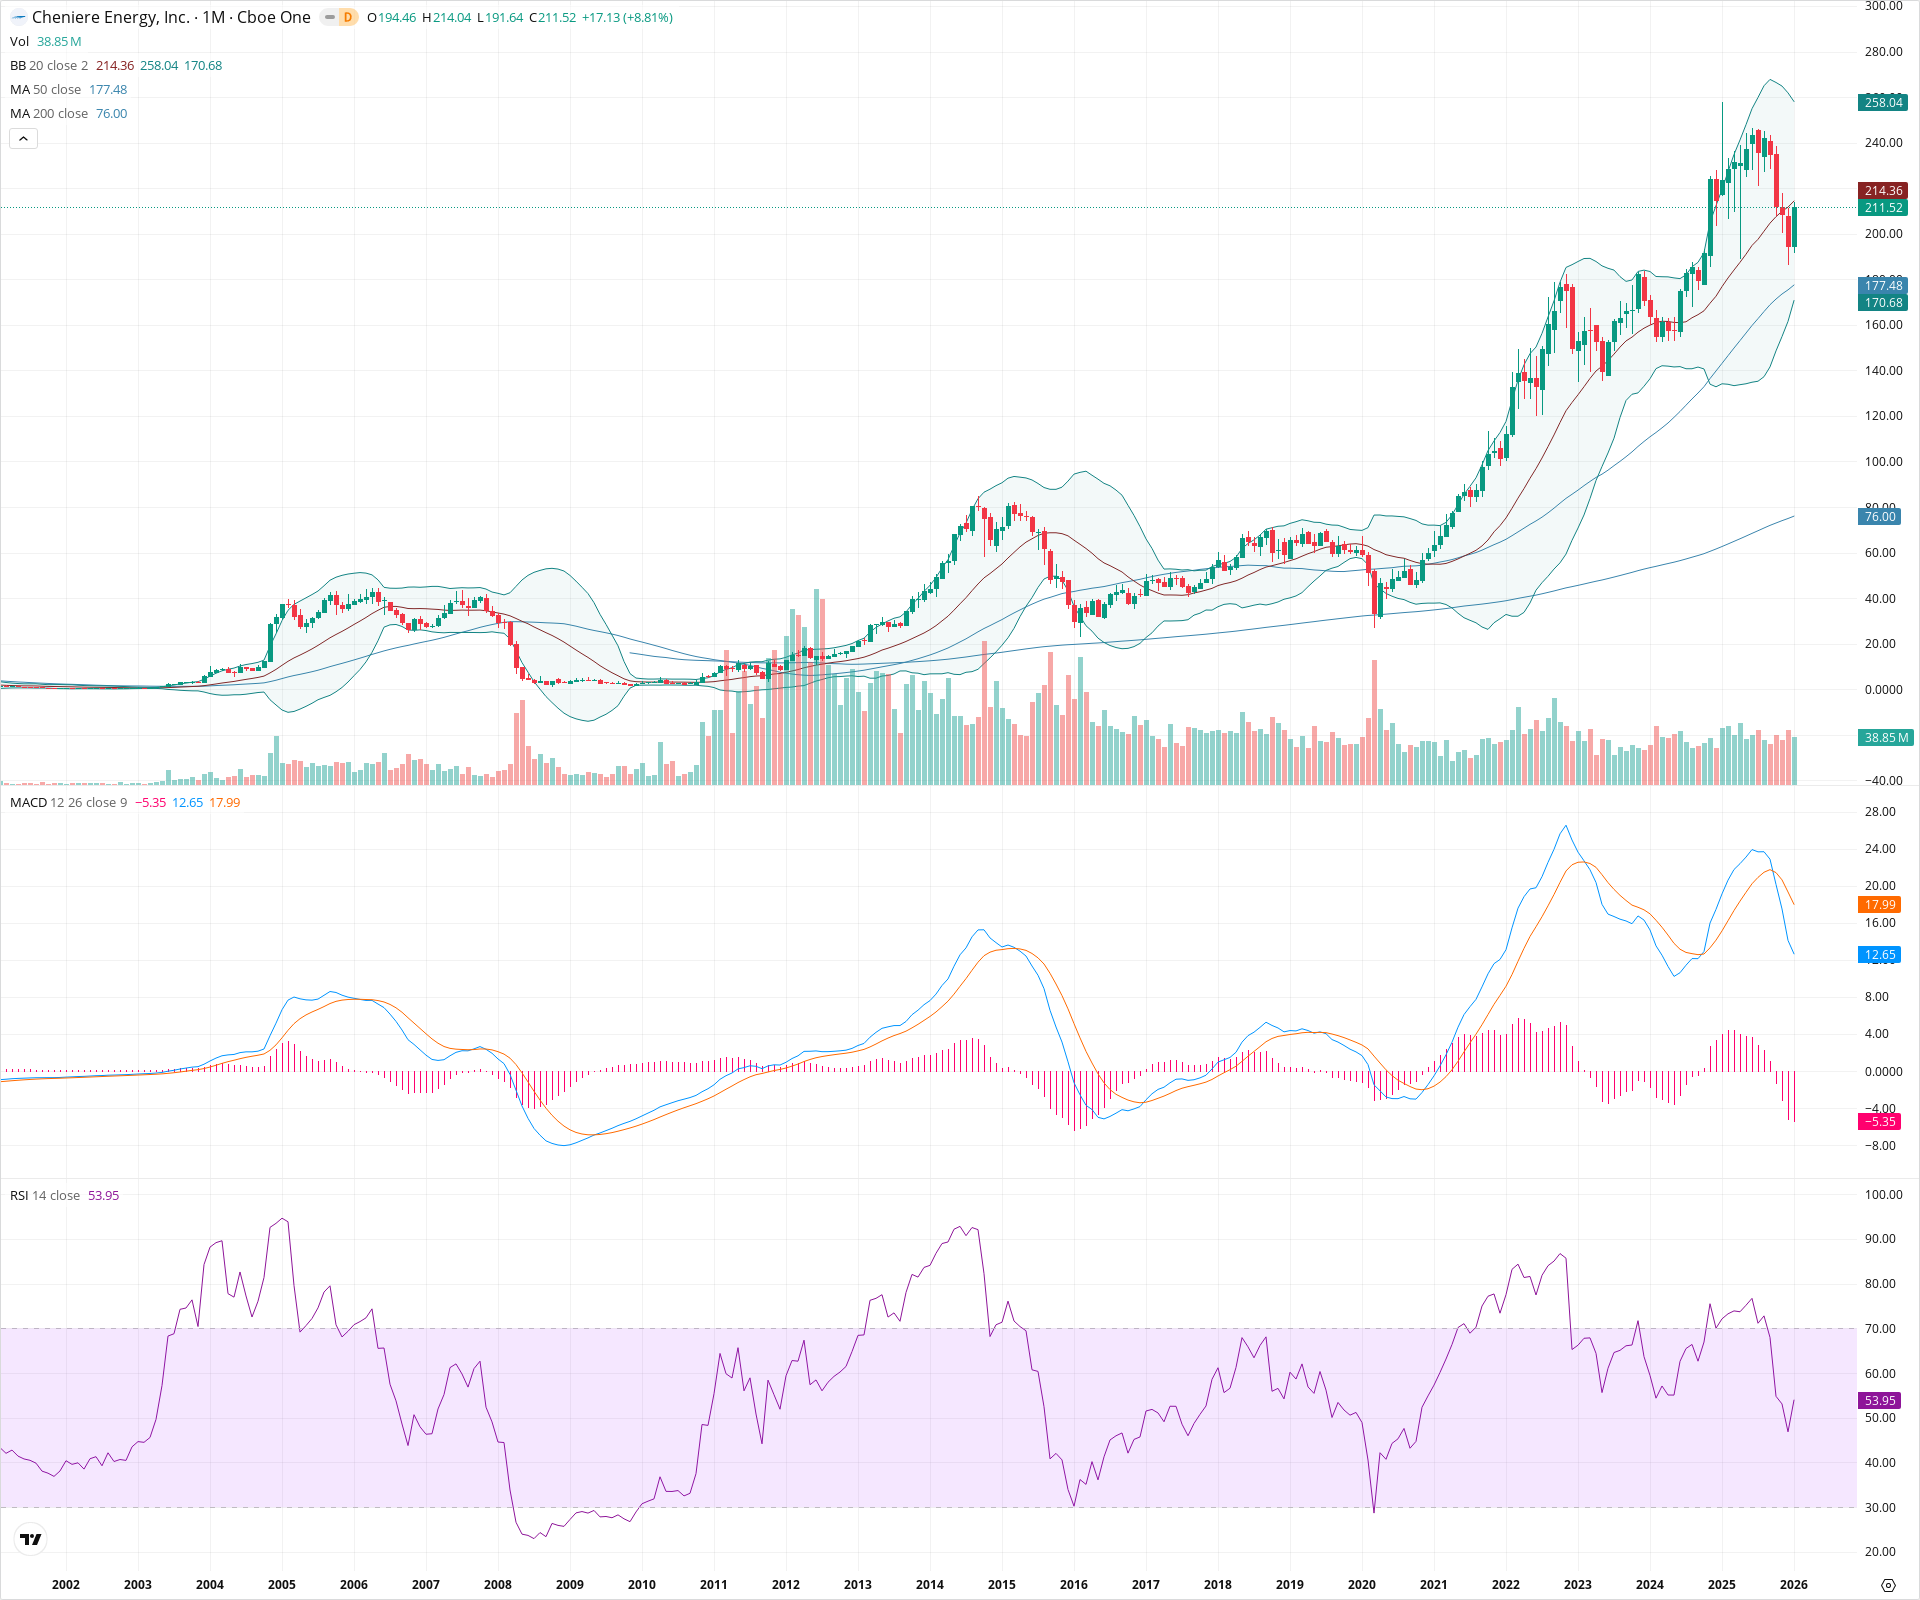
Cheniere Energy (LNG) is in a confirmed secular bull market, currently breaking out to new all-time highs above significant multi-year resistance. The strong alignment of moving averages and the recent thrust in price action suggest the long-term uptrend is resuming after a period of consolidation. Investors should watch for the 180-190 zone to hold as new support, with upside potential now in 'blue sky' price discovery territory.
Included In Lists
Related Tickers of Interest
LNG Monthly Chart
Sentiment
Short-term Sentiment (days to weeks): Bullish
The stock is printing a strong bullish marubozu-like candle for the current month, breaking out to new all-time highs above the 180-190 consolidation zone. Price is trading near the upper Bollinger Band, indicating strong momentum.
Long-term Sentiment (weeks to months): Bullish
Price structure is in a defined secular uptrend characterized by higher highs and higher lows. The stock is trading well above its rising 20, 50, and 200-month SMAs, confirming a robust long-term bull regime.
Report Metadata
- Timeframe: monthly
- Generated at: 2026-02-02T06:45:51.138Z
- Model: gemini-3-pro-preview
Support Price Levels
| Level | Range | Strength | Notes |
|---|---|---|---|
| $180.00 | $175.00 - $185.00 | Strong | Former major resistance zone (2022-2023 highs) now flips to secular support after the recent breakout. |
| $150.00 | $145.00 - $155.00 | Strong | Base of the recent multi-year consolidation pattern and convergence with rising moving averages. |
| $78.00 | $76.00 - $80.00 | Strong | Long-term structural floor aligned with the 200-month SMA. |
Resistance Price Levels
| Level | Range | Strength | Notes |
|---|---|---|---|
| $214.50 | $214.00 - $215.00 | Weak | Immediate resistance at the current monthly high and upper Bollinger Band vicinity. |
| $245.00 | $240.00 - $250.00 | Weak | Psychological resistance and potential trend extension targets as price enters discovery mode. |
Potential Chart Patterns in Formation
| Strength | Pattern | Signal | Target | Details |
|---|---|---|---|---|
| Strong | Consolidation Breakout | Bullish | N/A | Price has broken out from a multi-year consolidation range (approx. 140-185) established between 2022 and 2024. |
| Strong | Secular Uptrend | Bullish | N/A | A long-term trend of higher highs and higher lows active since 2016, supported by fanning moving averages. |
Frequently Asked Questions about LNG
What is the current sentiment for LNG?
The short-term sentiment for LNG is currently Bullish because The stock is printing a strong bullish marubozu-like candle for the current month, breaking out to new all-time highs above the 180-190 consolidation zone. Price is trading near the upper Bollinger Band, indicating strong momentum.. The long-term trend is classified as Bullish.
What are the key support levels for LNG?
StockDips.AI has identified key support levels for LNG at $180.00 and $150.00. These levels may represent potential accumulation zones where buying interest could emerge.
Is LNG in a significant dip or a Value Dip right now?
LNG has a Value Score of 37/100. It is not currently flagged as a significant dip in the Top Dips list. It is not listed as a Value Dip because the long-term sentiment or value-score threshold does not qualify.
View the full interactive analysis on StockDips.AI.