OPEN Weekly Technical Analysis
Opendoor Technologies Inc
Online real estate platform that buys and sells homes directly to simplify transactions.
OPEN Technical Analysis Summary
OPEN has experienced a protracted, multi-month bleed, retracing the vast majority of its prior explosive rally. The technical posture on the weekly timeframe is firmly bearish, with price entrenched in a descending channel and capped by key moving averages. The primary focus for long-term investors is whether the stock can find a definitive floor at the $3.00-$3.50 historical support zone to establish a structural higher low, or if it will fully re-enter its massive prior base.
Included In Lists
Related Tickers of Interest
OPEN Weekly Chart
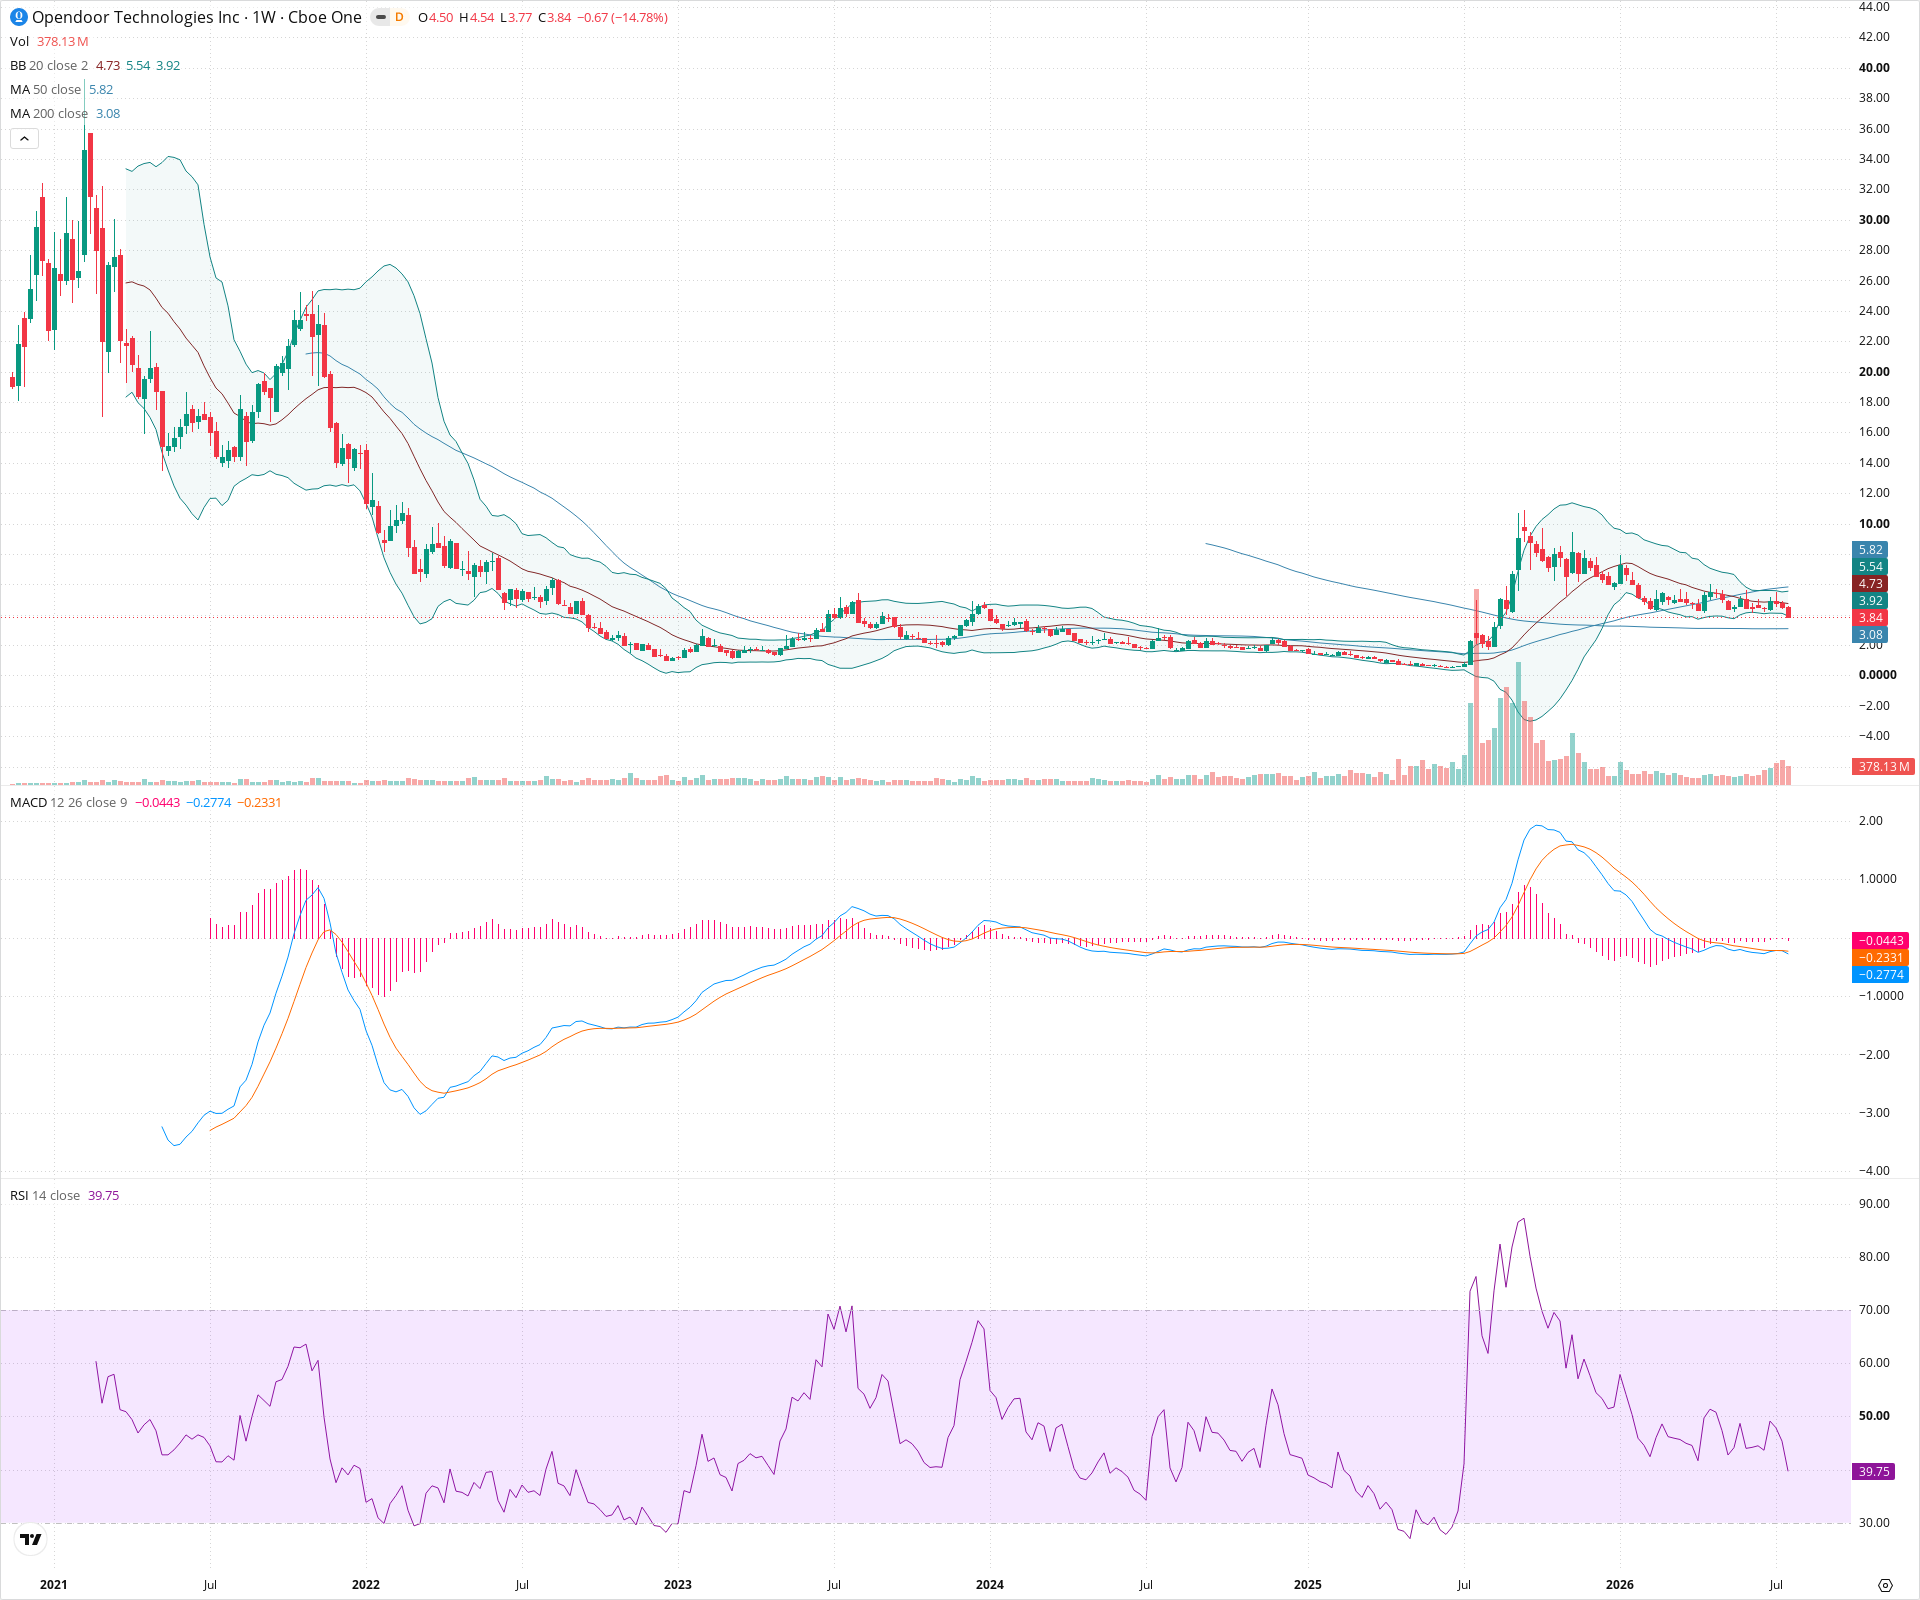
Sentiment
Short-term Sentiment (days to weeks): Bearish
Price is trending downwards below descending 20-week and 50-week SMAs, with MACD in negative territory and RSI showing weak momentum below 50.
Long-term Sentiment (weeks to months): Bearish
The chart remains in a dominant long-term downtrend, having surrendered most gains from a massive bear market rally, and remains structurally below a declining 200-week SMA.
Report Metadata
- Timeframe: weekly
- Generated at: 2026-07-25T09:08:47.498Z
- Model: gemini-3.1-pro-preview
Support Price Levels
| Level | Range | Strength | Notes |
|---|---|---|---|
| $3.25 | $3.00 - $3.50 | Strong | Top of the historical multi-year basing range and the origin area of the previous massive volume breakout. |
| $2.00 | $1.50 - $2.50 | Strong | Core zone of the deep, multi-year consolidation base formed before the major price spike. |
Resistance Price Levels
| Level | Range | Strength | Notes |
|---|---|---|---|
| $5.00 | $4.50 - $5.50 | Weak | Recent consolidation area that price broke down from, aligning with the declining 20-week SMA. |
| $6.50 | $6.00 - $7.00 | Strong | Previous major swing high on the descent from the peak, coinciding roughly with the 50-week SMA. |
Potential Chart Patterns in Formation
| Strength | Pattern | Signal | Target | Details |
|---|---|---|---|---|
| Strong | Descending Channel | Bearish | N/A | Price action since the major peak has formed a consistent sequence of lower highs and lower lows, contained within parallel downward trendlines. |
Frequently Asked Questions about OPEN
What is the current sentiment for OPEN?
The short-term sentiment for OPEN is currently Bearish because Price is trending downwards below descending 20-week and 50-week SMAs, with MACD in negative territory and RSI showing weak momentum below 50.. The long-term trend is classified as Bearish.
What are the key support levels for OPEN?
StockDips.AI has identified key support levels for OPEN at $3.25 and $2.00. These levels may represent potential accumulation zones where buying interest could emerge.
Is OPEN in a significant dip or a Value Dip right now?
OPEN has a Value Score of 39/100. It is not currently flagged as a significant dip in the Top Dips list. It is not listed as a Value Dip because the long-term sentiment or value-score threshold does not qualify.
View the full interactive analysis on StockDips.AI.