OPEN Daily Technical Analysis
Opendoor Technologies Inc
Online real estate platform that buys and sells homes directly to simplify transactions.
OPEN Technical Analysis Summary
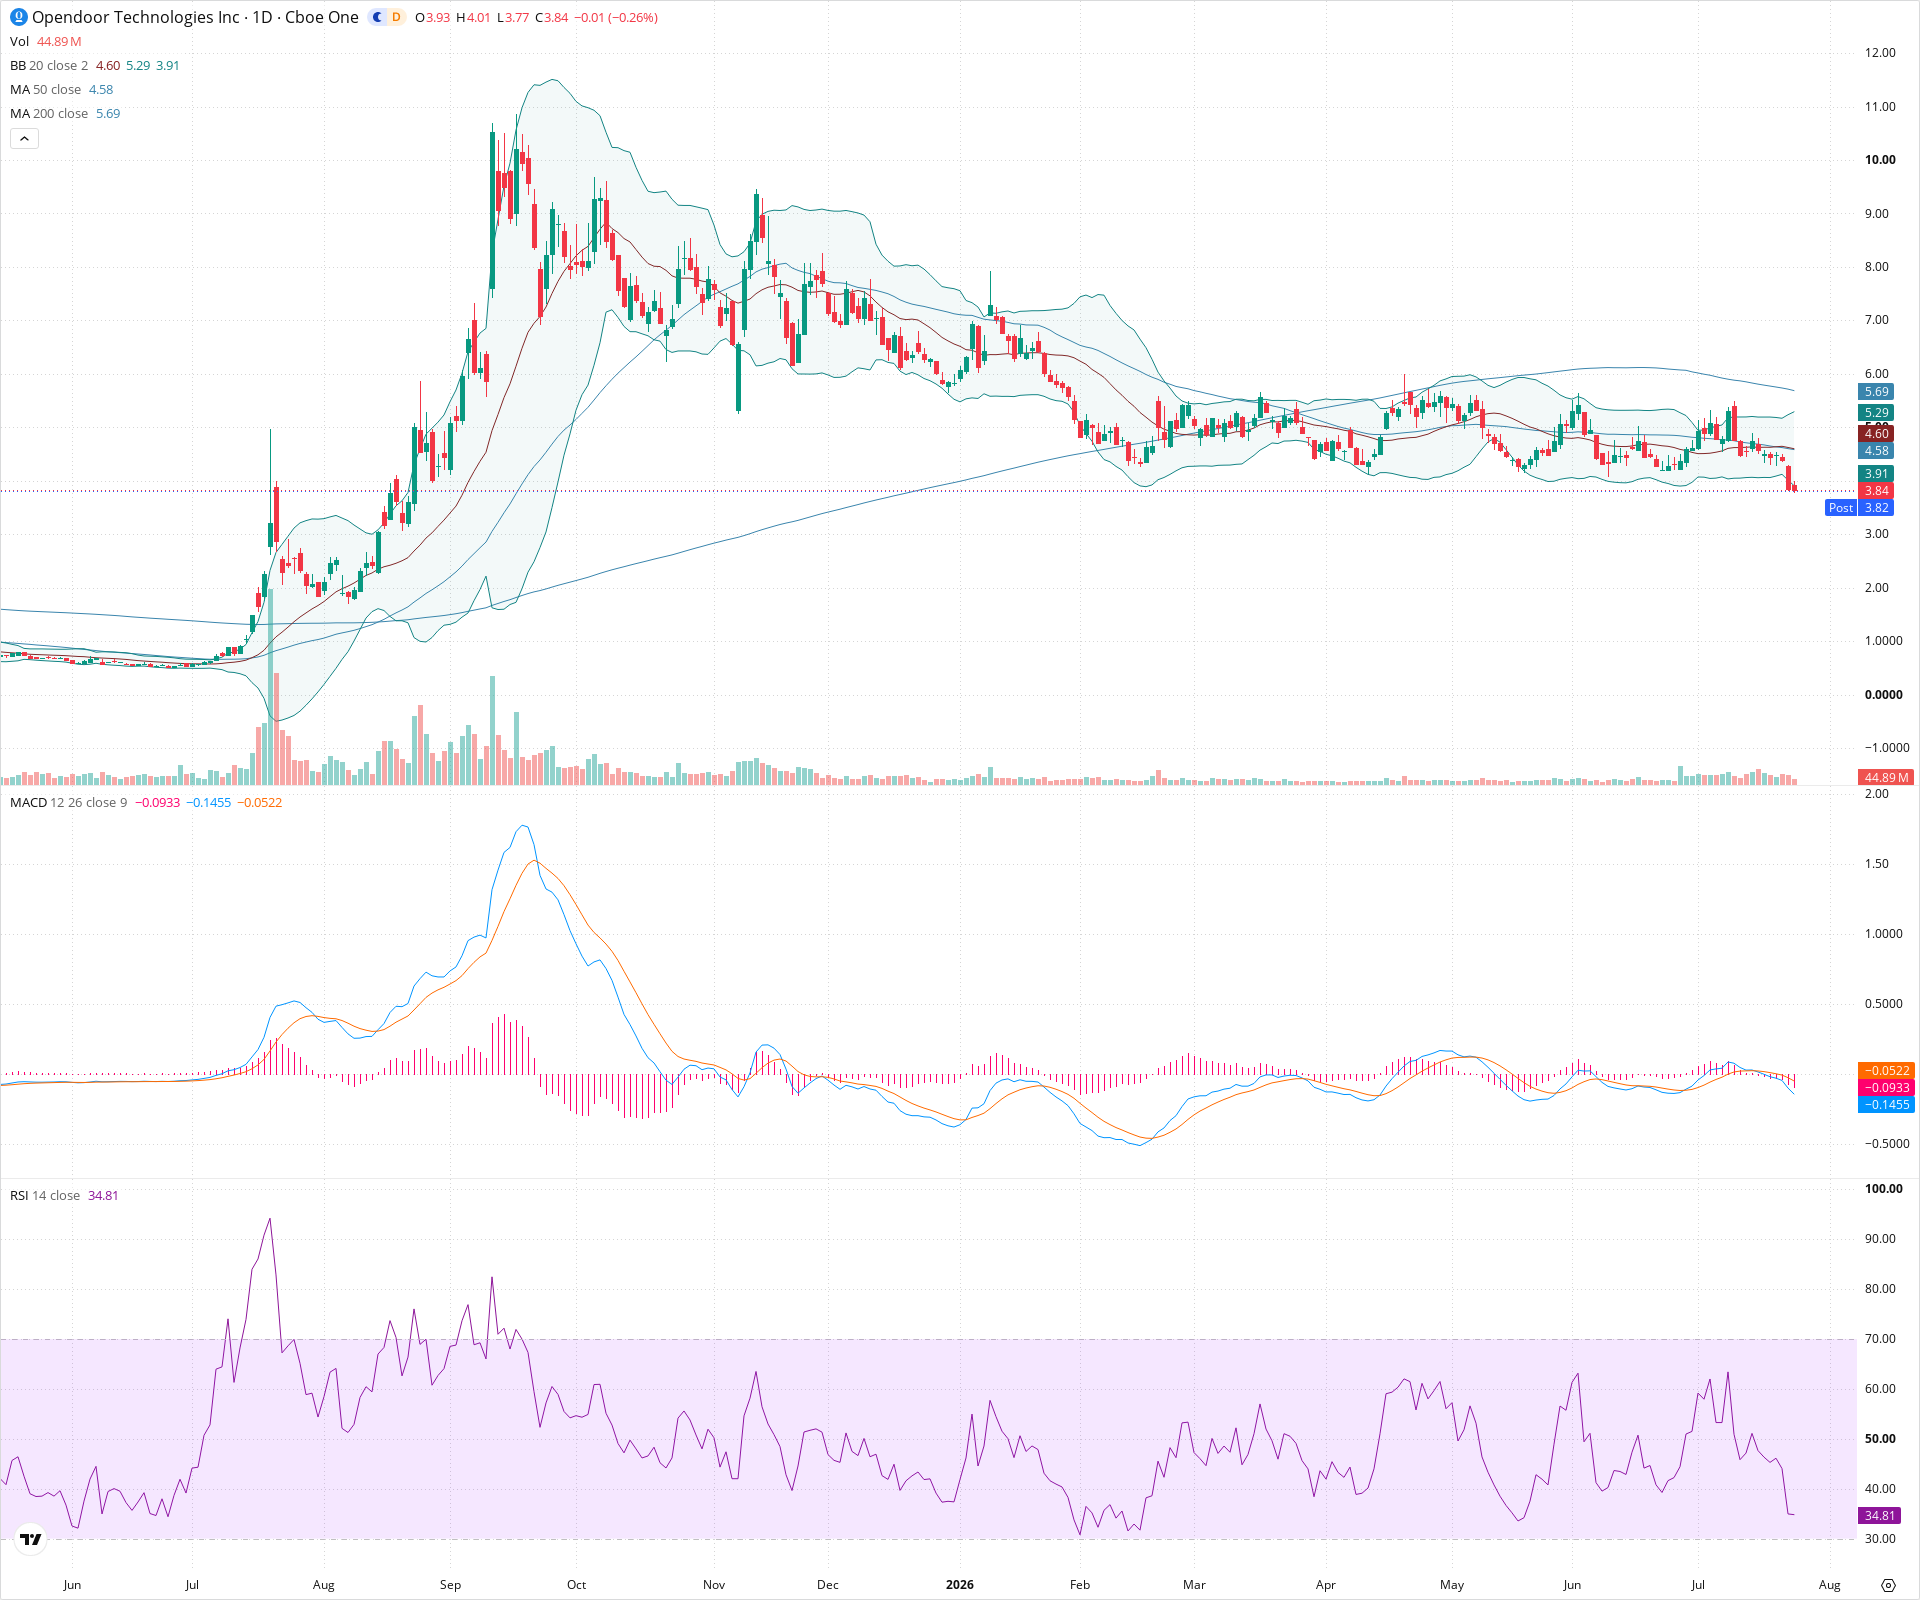
OPEN is exhibiting extreme weakness, characterized by a persistent long-term downtrend after a massive parabolic peak. The recent breakdown below the $4.00 support level signifies a resumption of selling pressure, further confirmed by bearish MACD momentum and price piercing the lower Bollinger Band. Until the stock can reclaim the heavy resistance cluster around $4.60 (where the 20-day and 50-day moving averages reside), the path of least resistance points toward its historical baseline near $2.00.
Included In Lists
Related Tickers of Interest
OPEN Daily Chart
Sentiment
Short-term Sentiment (days to weeks): Bearish
Price has recently broken down below a multi-month support level near $4.00, closing outside the lower Bollinger Band with expanding negative momentum on the MACD histogram.
Long-term Sentiment (weeks to months): Bearish
The stock is entrenched in a prolonged downtrend following a major blow-off top. It trades well below a declining 200-day SMA, and the 50-day SMA remains positioned beneath the 200-day SMA.
Report Metadata
- Timeframe: daily
- Generated at: 2026-07-24T21:09:59.999Z
- Model: gemini-3.1-pro-preview
Support Price Levels
| Level | Range | Strength | Notes |
|---|---|---|---|
| $3.10 | $3.00 - $3.20 | Weak | Psychological whole number support and minor area of pause during previous historical climbs. |
| $1.75 | $1.50 - $2.00 | Strong | Historical base consolidation zone that formed prior to the massive breakout rally. |
Resistance Price Levels
| Level | Range | Strength | Notes |
|---|---|---|---|
| $4.30 | $4.00 - $4.60 | Strong | Former multi-month support floor now turning into resistance, reinforced by the converging 20-day and 50-day SMAs. |
| $5.75 | $5.50 - $6.00 | Strong | Swing high from recent consolidation range, closely aligned with the 200-day SMA. |
Potential Chart Patterns in Formation
| Strength | Pattern | Signal | Target | Details |
|---|---|---|---|---|
| Strong | Consolidation Breakdown | Bearish | $2.00 | Price broke aggressively below the ~$4.00 horizontal support level that had contained price action for several months, signaling a continuation of the primary downtrend. |
Frequently Asked Questions about OPEN
What is the current sentiment for OPEN?
The short-term sentiment for OPEN is currently Bearish because Price has recently broken down below a multi-month support level near $4.00, closing outside the lower Bollinger Band with expanding negative momentum on the MACD histogram.. The long-term trend is classified as Bearish.
What are the key support levels for OPEN?
StockDips.AI has identified key support levels for OPEN at $3.10 and $1.75. These levels may represent potential accumulation zones where buying interest could emerge.
Is OPEN in a significant dip or a Value Dip right now?
OPEN has a Value Score of 39/100. It is not currently flagged as a significant dip in the Top Dips list. It is not listed as a Value Dip because the long-term sentiment or value-score threshold does not qualify.
View the full interactive analysis on StockDips.AI.