OPEN Monthly Technical Analysis
Opendoor Technologies Inc
Online real estate platform that buys and sells homes directly to simplify transactions.
OPEN Technical Analysis Summary
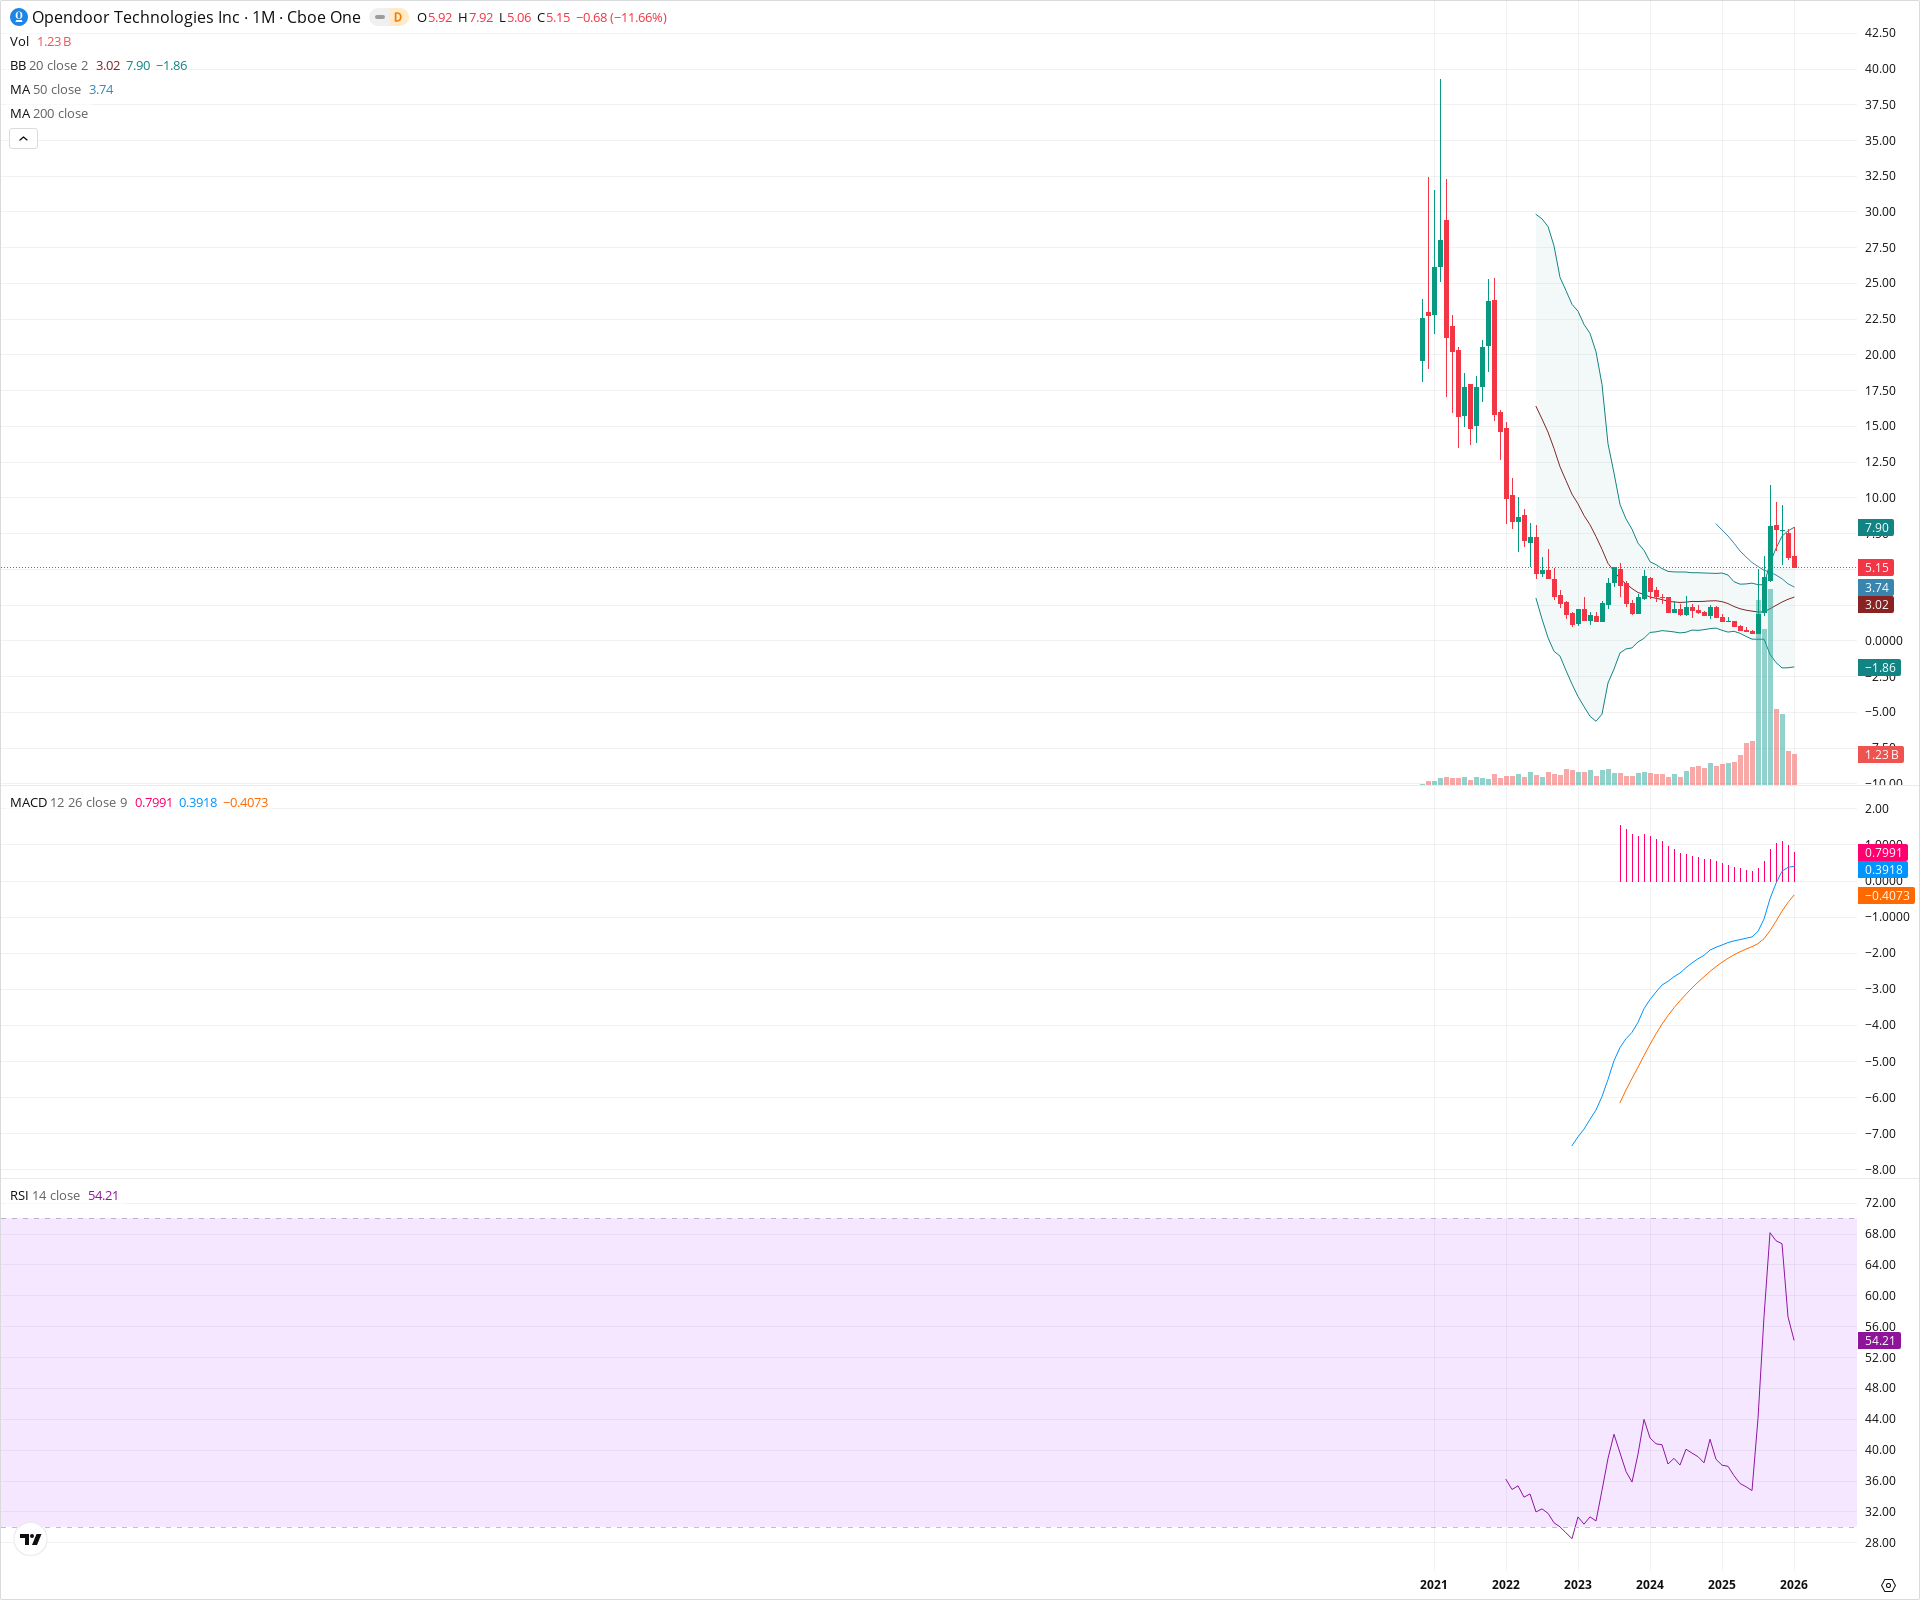
Opendoor Technologies is undergoing a major structural turnaround, having built a rounding bottom base over the last two years and recently breaking above the key 50-month SMA. Momentum indicators confirm this shift, with the monthly MACD entering positive territory for the first time in years. Although price is currently pulling back from the upper volatility band, the long-term setup suggests a transition from a bear market to a potential secular uptrend.
Included In Lists
Related Tickers of Interest
OPEN Monthly Chart
Sentiment
Short-term Sentiment (days to weeks): Neutral
While the stock is in a broader uptrend, the current monthly candle is a significant red pullback (-11.66%) from the Upper Bollinger Band and recent highs, suggesting a period of consolidation or retest of breakout levels.
Long-term Sentiment (weeks to months): Bullish
The stock has successfully transitioned out of a secular downtrend, forming a multi-year base and reclaiming the 50-month SMA. The MACD has crossed into positive territory, and RSI is holding above 50, indicating a structural regime change favoring accumulation.
Report Metadata
- Timeframe: monthly
- Generated at: 2026-02-02T06:55:11.638Z
- Model: gemini-3-pro-preview
Support Price Levels
| Level | Range | Strength | Notes |
|---|---|---|---|
| $3.75 | $3.70 - $3.80 | Strong | Confluence of the 50-month SMA (3.74) and previous resistance-turned-support. |
| $3.00 | $2.90 - $3.10 | Strong | Aligns with the 20-month SMA (3.02) and the midline of the Bollinger Bands. |
| $1.25 | $1.00 - $1.50 | Strong | The secular floor and historical lows established during the 2022-2023 accumulation phase. |
Resistance Price Levels
| Level | Range | Strength | Notes |
|---|---|---|---|
| $7.90 | $7.80 - $8.00 | Weak | Recent swing high (7.92) and current Upper Bollinger Band (7.90) where price was rejected. |
| $10.00 | $9.50 - $10.50 | Strong | Historical breakdown zone and psychological resistance level. |
| $15.25 | $14.50 - $16.00 | Strong | Major structural resistance from previous downtrend consolidation areas. |
Potential Chart Patterns in Formation
| Strength | Pattern | Signal | Target | Details |
|---|---|---|---|---|
| Strong | Rounding Bottom | Bullish | N/A | A long-term U-shaped base forming from 2022 to present, indicating a gradual shift from selling pressure to accumulation. |
Frequently Asked Questions about OPEN
What is the current sentiment for OPEN?
The short-term sentiment for OPEN is currently Neutral because While the stock is in a broader uptrend, the current monthly candle is a significant red pullback (-11.66%) from the Upper Bollinger Band and recent highs, suggesting a period of consolidation or retest of breakout levels.. The long-term trend is classified as Bullish.
What are the key support levels for OPEN?
StockDips.AI has identified key support levels for OPEN at $3.75 and $3.00. These levels may represent potential accumulation zones where buying interest could emerge.
Is OPEN in a significant dip or a Value Dip right now?
OPEN has a Value Score of 39/100. It is not currently flagged as a significant dip in the Top Dips list. It is not listed as a Value Dip because the long-term sentiment or value-score threshold does not qualify.
View the full interactive analysis on StockDips.AI.