RDDT Weekly Technical Analysis
Reddit Inc
Social media platform organized by communities with strong retail investor influence.
RDDT Technical Analysis Summary
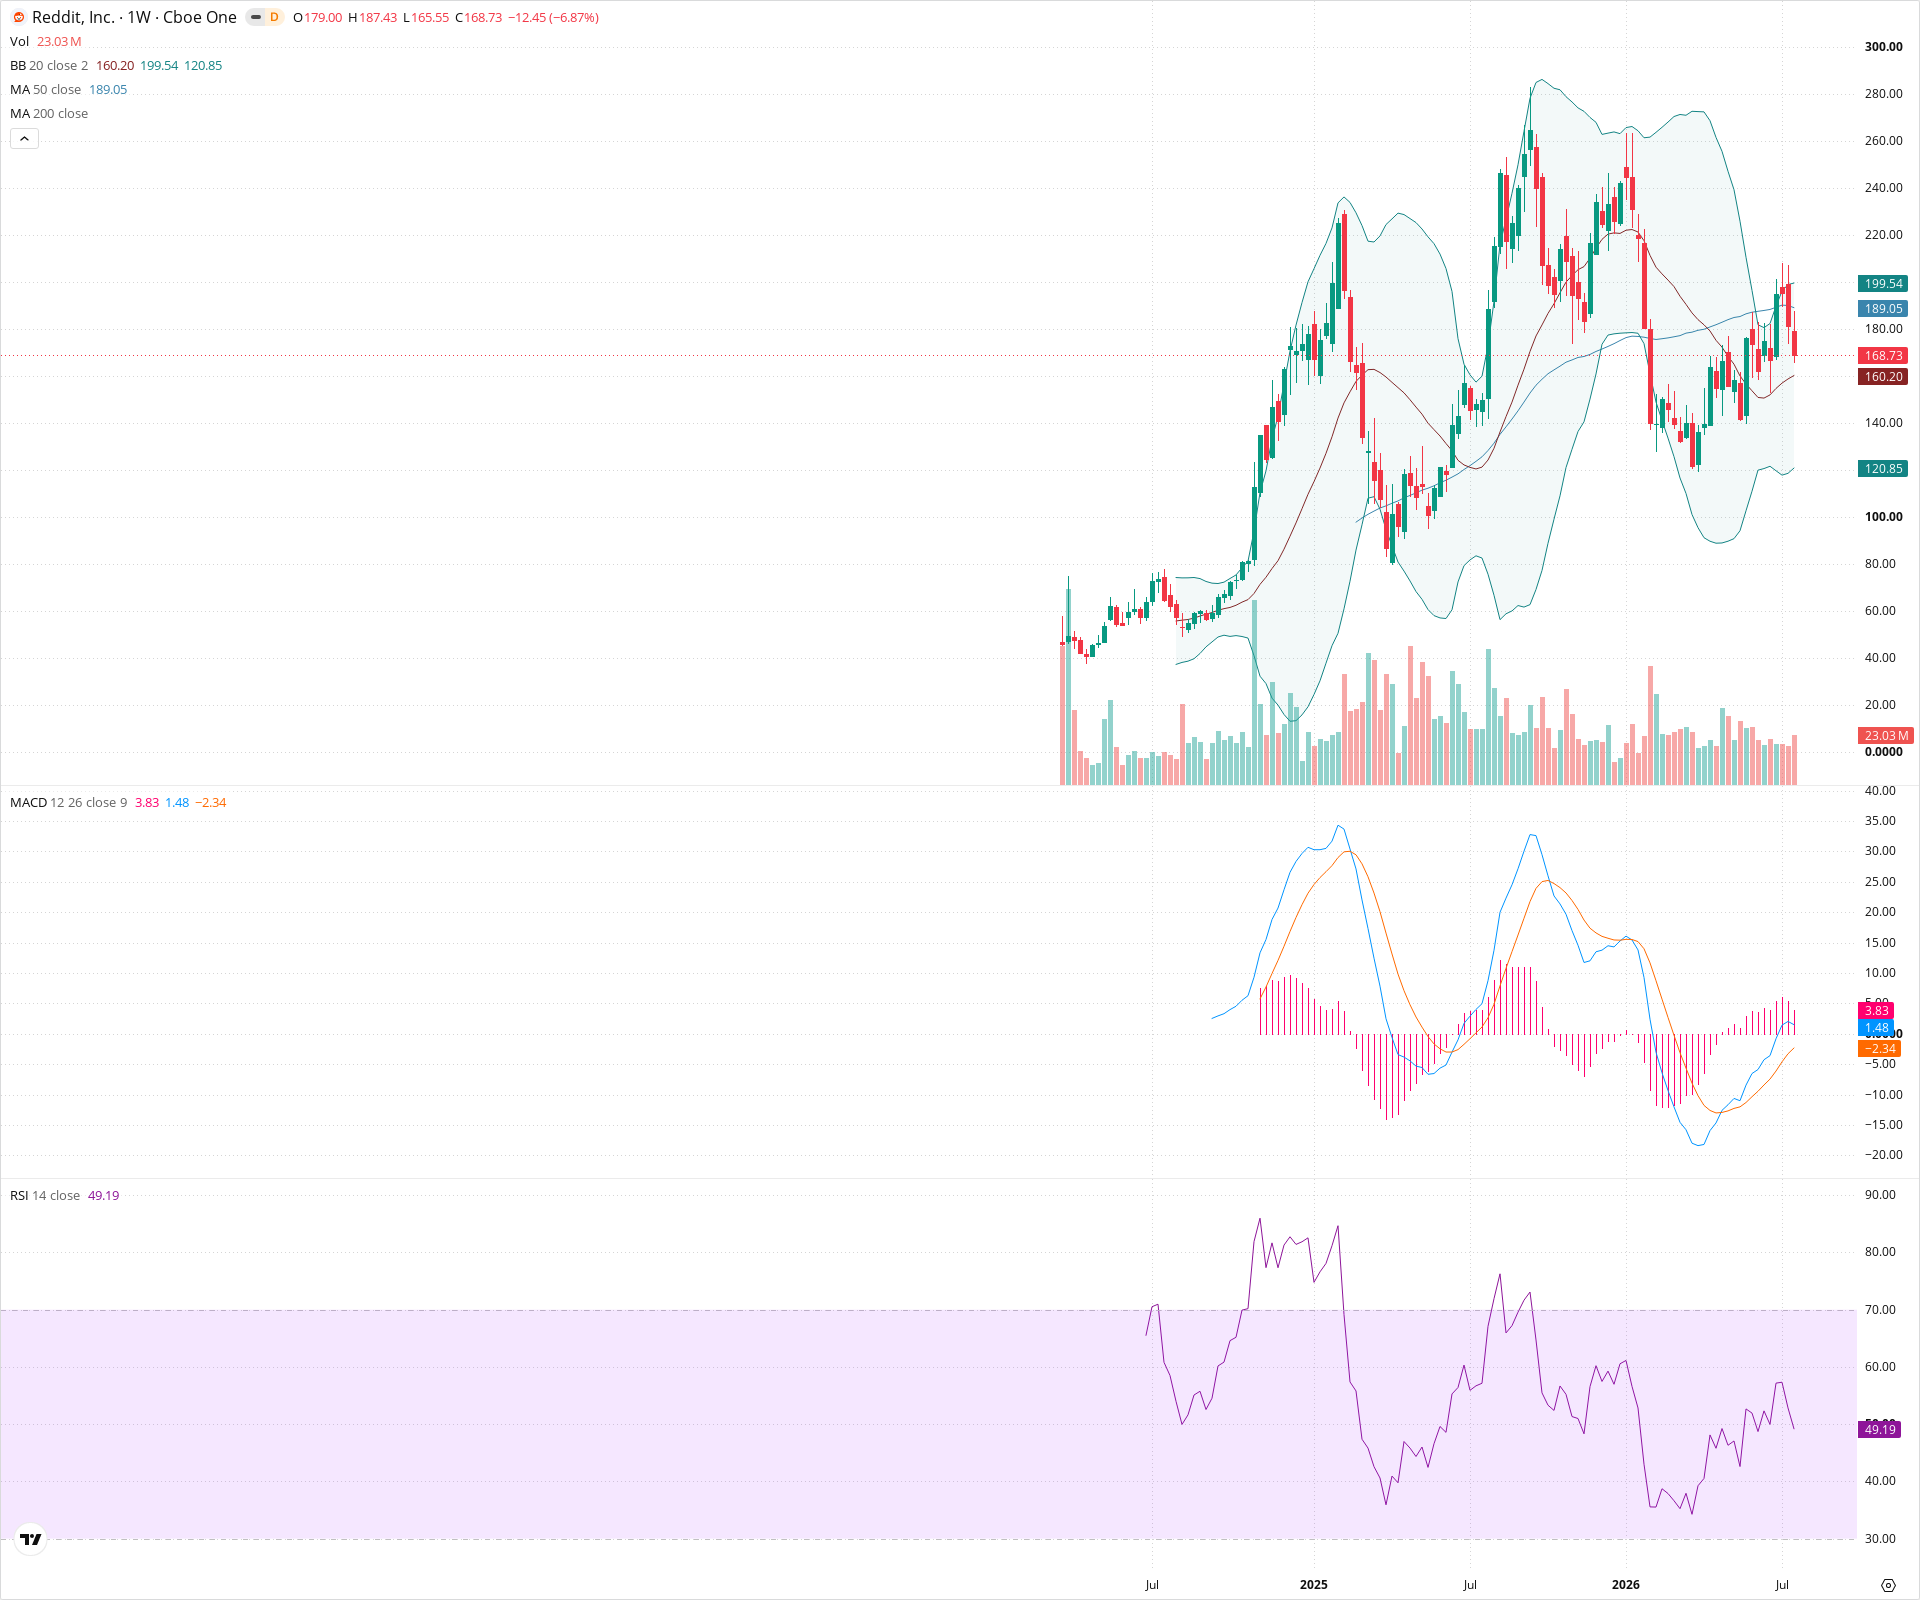
RDDT has transitioned from a parabolic uptrend into a massive, multi-year consolidation phase. The long-term technical picture is neutral as the price chops sideways, currently constrained below a flattening 50-week SMA. A decisive breakdown below the major 120 support floor would be highly bearish, while reclaiming the 200 level and the 50-week SMA is required to improve the long-term outlook.
Included In Lists
Related Tickers of Interest
RDDT Weekly Chart
Sentiment
Short-term Sentiment (days to weeks): Bearish
Price recently faced a sharp rejection near the 200 level, failing to break above the 50-week SMA. The current large bearish weekly candle suggests renewed downward momentum in the near term.
Long-term Sentiment (weeks to months): Neutral
The asset is locked in a massive, multi-year consolidation range following a parabolic advance. Price is currently fluctuating below a flattening 50-week SMA, indicating a lack of clear long-term directional trend.
Report Metadata
- Timeframe: weekly
- Generated at: 2026-07-25T09:09:33.499Z
- Model: gemini-3.1-pro-preview
Support Price Levels
| Level | Range | Strength | Notes |
|---|---|---|---|
| $160.00 | $158.00 - $162.00 | Weak | Immediate minor support area near the 20-week SMA (middle Bollinger Band). |
| $127.50 | $120.00 - $135.00 | Strong | Major historical support zone where multiple significant bounces have occurred; aligns with the lower Bollinger Band. |
| $70.00 | $60.00 - $80.00 | Strong | Deep structural support representing the initial accumulation base before the historical breakout. |
Resistance Price Levels
| Level | Range | Strength | Notes |
|---|---|---|---|
| $194.50 | $189.00 - $200.00 | Strong | Significant resistance zone defined by recent price rejection, the 50-week SMA, and the upper Bollinger Band. |
| $247.50 | $240.00 - $255.00 | Strong | Major structural lower-high established in late 2025. |
| $282.50 | $275.00 - $290.00 | Strong | The all-time high area; ultimate overhead resistance. |
Potential Chart Patterns in Formation
| Strength | Pattern | Signal | Target | Details |
|---|---|---|---|---|
| Strong | Broad Consolidation Range | Neutral | N/A | Price has been fluctuating in a highly volatile, wide range roughly between 120 and 280 for an extended period following its initial massive surge. |
Frequently Asked Questions about RDDT
What is the current sentiment for RDDT?
The short-term sentiment for RDDT is currently Bearish because Price recently faced a sharp rejection near the 200 level, failing to break above the 50-week SMA. The current large bearish weekly candle suggests renewed downward momentum in the near term.. The long-term trend is classified as Neutral.
What are the key support levels for RDDT?
StockDips.AI has identified key support levels for RDDT at $160.00 and $127.50. These levels may represent potential accumulation zones where buying interest could emerge.
Is RDDT in a significant dip or a Value Dip right now?
RDDT has a Value Score of 57/100. It is not currently flagged as a significant dip in the Top Dips list. It is not listed as a Value Dip because the long-term sentiment or value-score threshold does not qualify.
View the full interactive analysis on StockDips.AI.