RDDT Monthly Technical Analysis
Reddit Inc
Social media platform organized by communities with strong retail investor influence.
RDDT Technical Analysis Summary
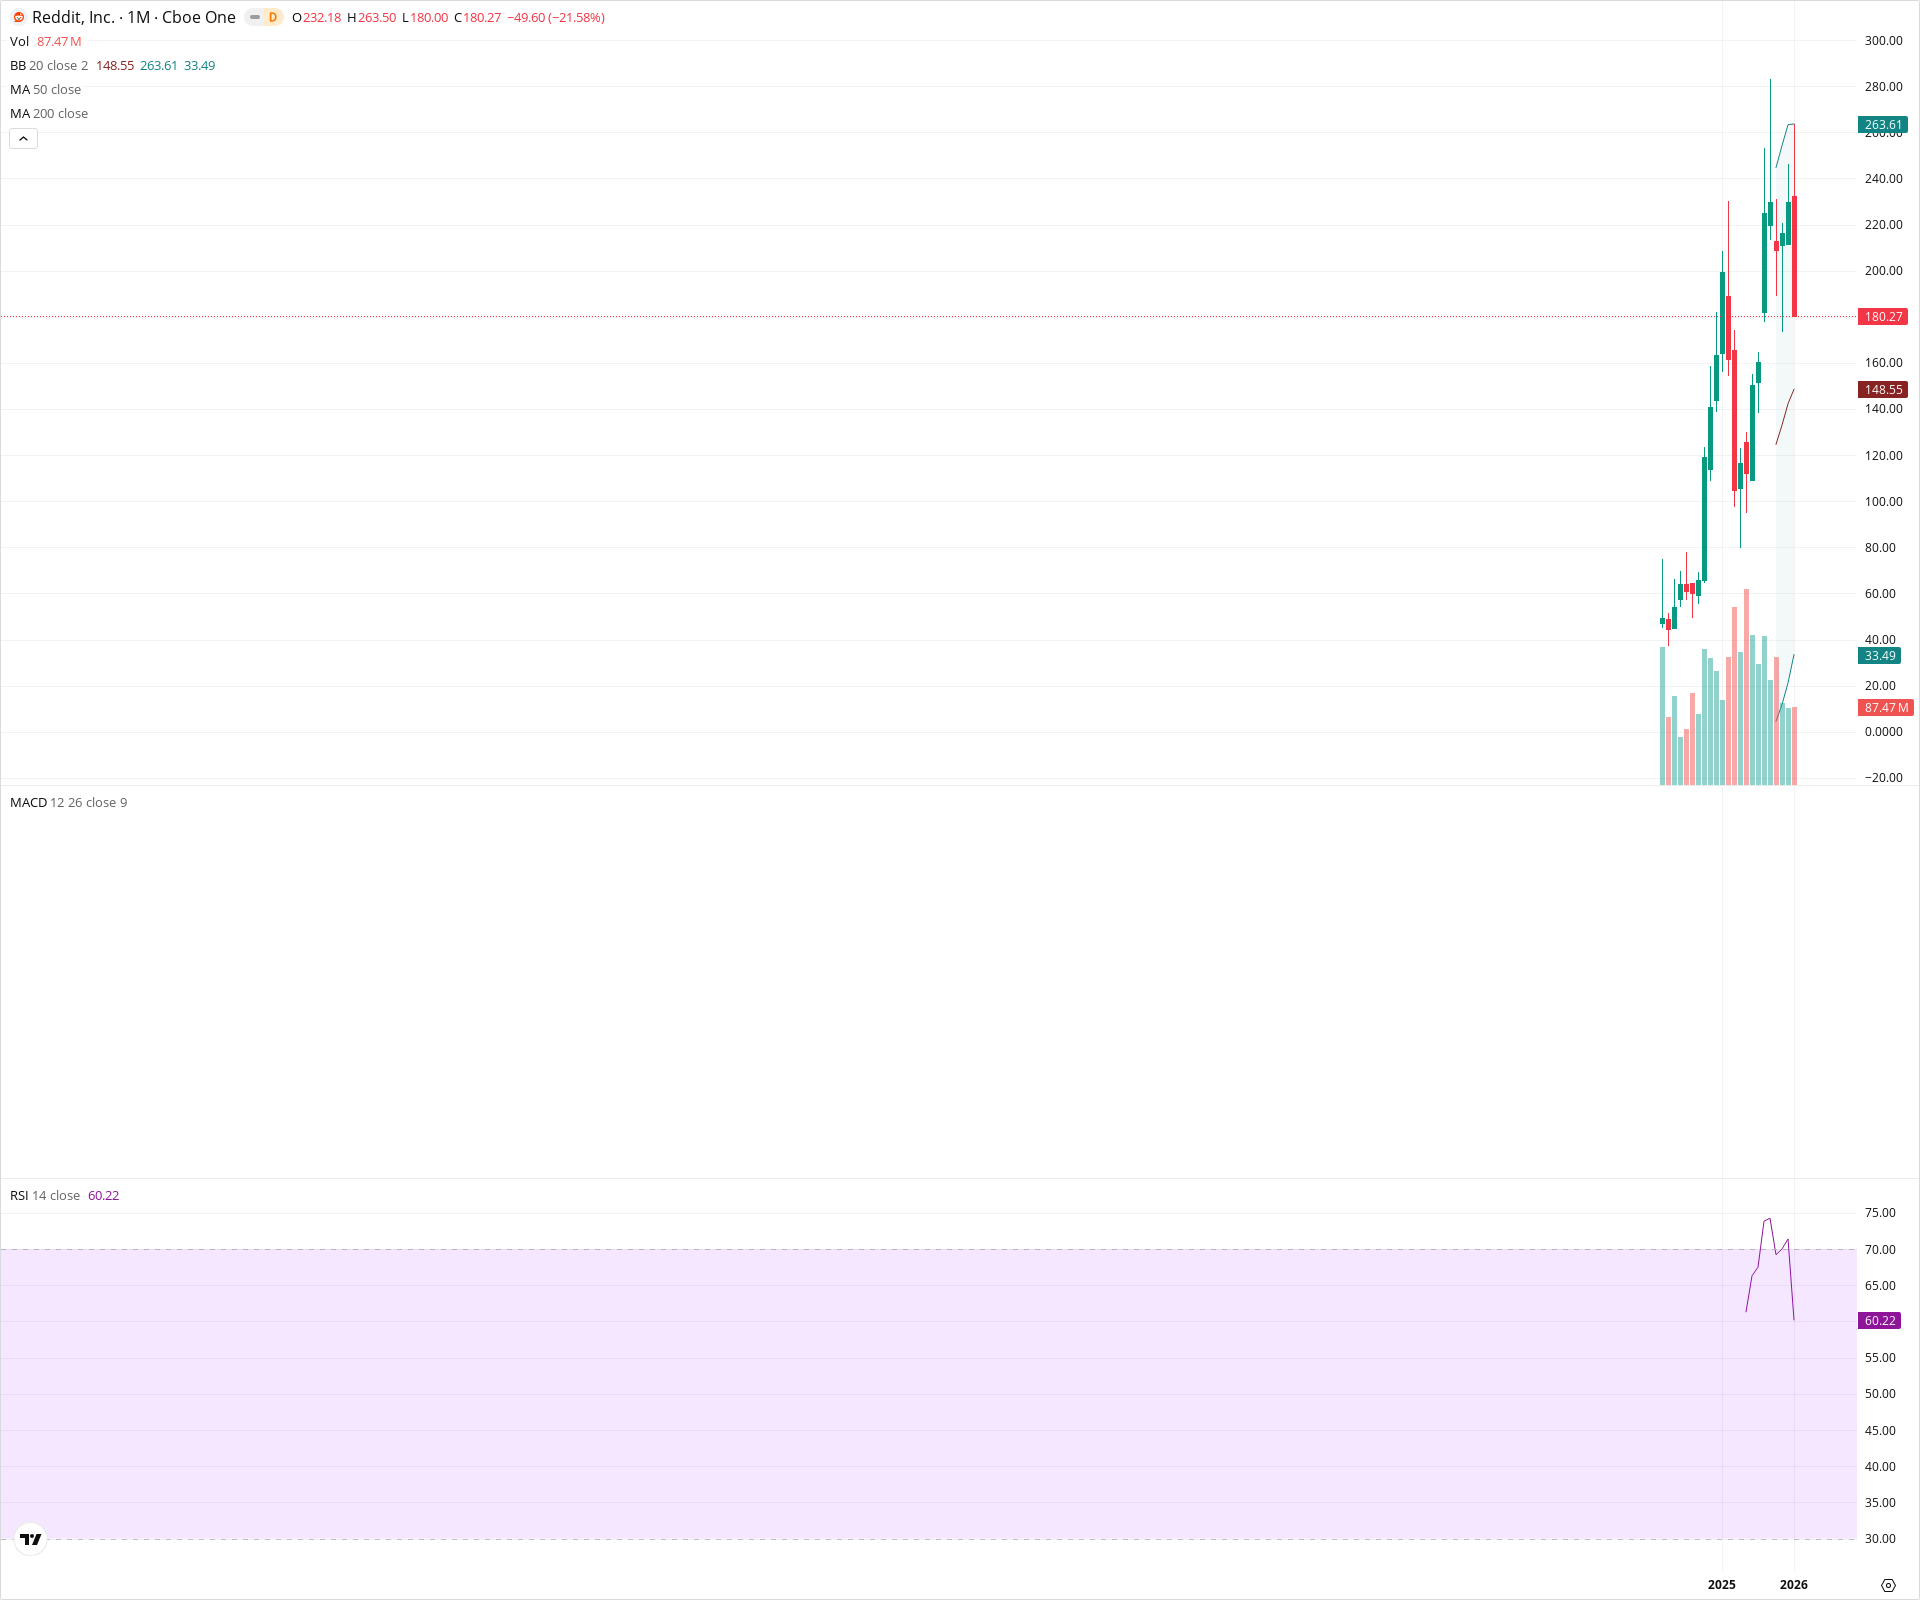
RDDT is exhibiting a sharp correction following a parabolic advance, with the current monthly candle erasing over 20% of value and rejecting from all-time highs. While the long-term trend remains technically bullish above the 20-month SMA, the immediate price action suggests a significant volatility regime change and potential distribution phase. The RSI hooking down from overbought territory supports the view that the exuberant momentum is cooling. The 148.55 level serves as the critical line in the sand for the secular bull trend.
Included In Lists
Related Tickers of Interest
RDDT Monthly Chart
Sentiment
Short-term Sentiment (days to weeks): Bearish
The current monthly candle shows a massive decline of over 21% with a wide range, rejecting sharply from all-time highs and indicating a strong shift in immediate momentum.
Long-term Sentiment (weeks to months): Bullish
Despite the sharp pullback, the primary trend remains vertically upward. The price is trading well above the 20-month SMA (148.55), keeping the secular uptrend intact.
Report Metadata
- Timeframe: monthly
- Generated at: 2026-02-02T06:56:57.711Z
- Model: gemini-3-pro-preview
Support Price Levels
| Level | Range | Strength | Notes |
|---|---|---|---|
| $148.50 | $148.00 - $149.00 | Strong | Coincides with the 20-month SMA and the midpoint of the Bollinger Bands. |
| $125.00 | $120.00 - $130.00 | Weak | Previous consolidation zone before the final parabolic leg up. |
| $72.50 | $70.00 - $75.00 | Strong | Major structural base and breakout level from early trading history. |
Resistance Price Levels
| Level | Range | Strength | Notes |
|---|---|---|---|
| $233.50 | $232.00 - $235.00 | Weak | Approximate open of the current bearish monthly candle. |
| $263.50 | $263.00 - $264.00 | Strong | All-time high and upper Bollinger Band resistance. |
Potential Chart Patterns in Formation
| Strength | Pattern | Signal | Target | Details |
|---|---|---|---|---|
| Strong | Parabolic Blow-off Top | Bearish | $148.55 | After a vertical ascent, the price has printed a large bearish candle rejecting the highs, signaling a potential climax to the trend. |
Frequently Asked Questions about RDDT
What is the current sentiment for RDDT?
The short-term sentiment for RDDT is currently Bearish because The current monthly candle shows a massive decline of over 21% with a wide range, rejecting sharply from all-time highs and indicating a strong shift in immediate momentum.. The long-term trend is classified as Bullish.
What are the key support levels for RDDT?
StockDips.AI has identified key support levels for RDDT at $148.50 and $125.00. These levels may represent potential accumulation zones where buying interest could emerge.
Is RDDT in a significant dip or a Value Dip right now?
RDDT has a Value Score of 57/100. It is not currently flagged as a significant dip in the Top Dips list. It is not listed as a Value Dip because the long-term sentiment or value-score threshold does not qualify.
View the full interactive analysis on StockDips.AI.