SOFI Weekly Technical Analysis
SoFi Technologies Inc
Fintech offering digital banking, lending, and investing services.
SOFI Technical Analysis Summary
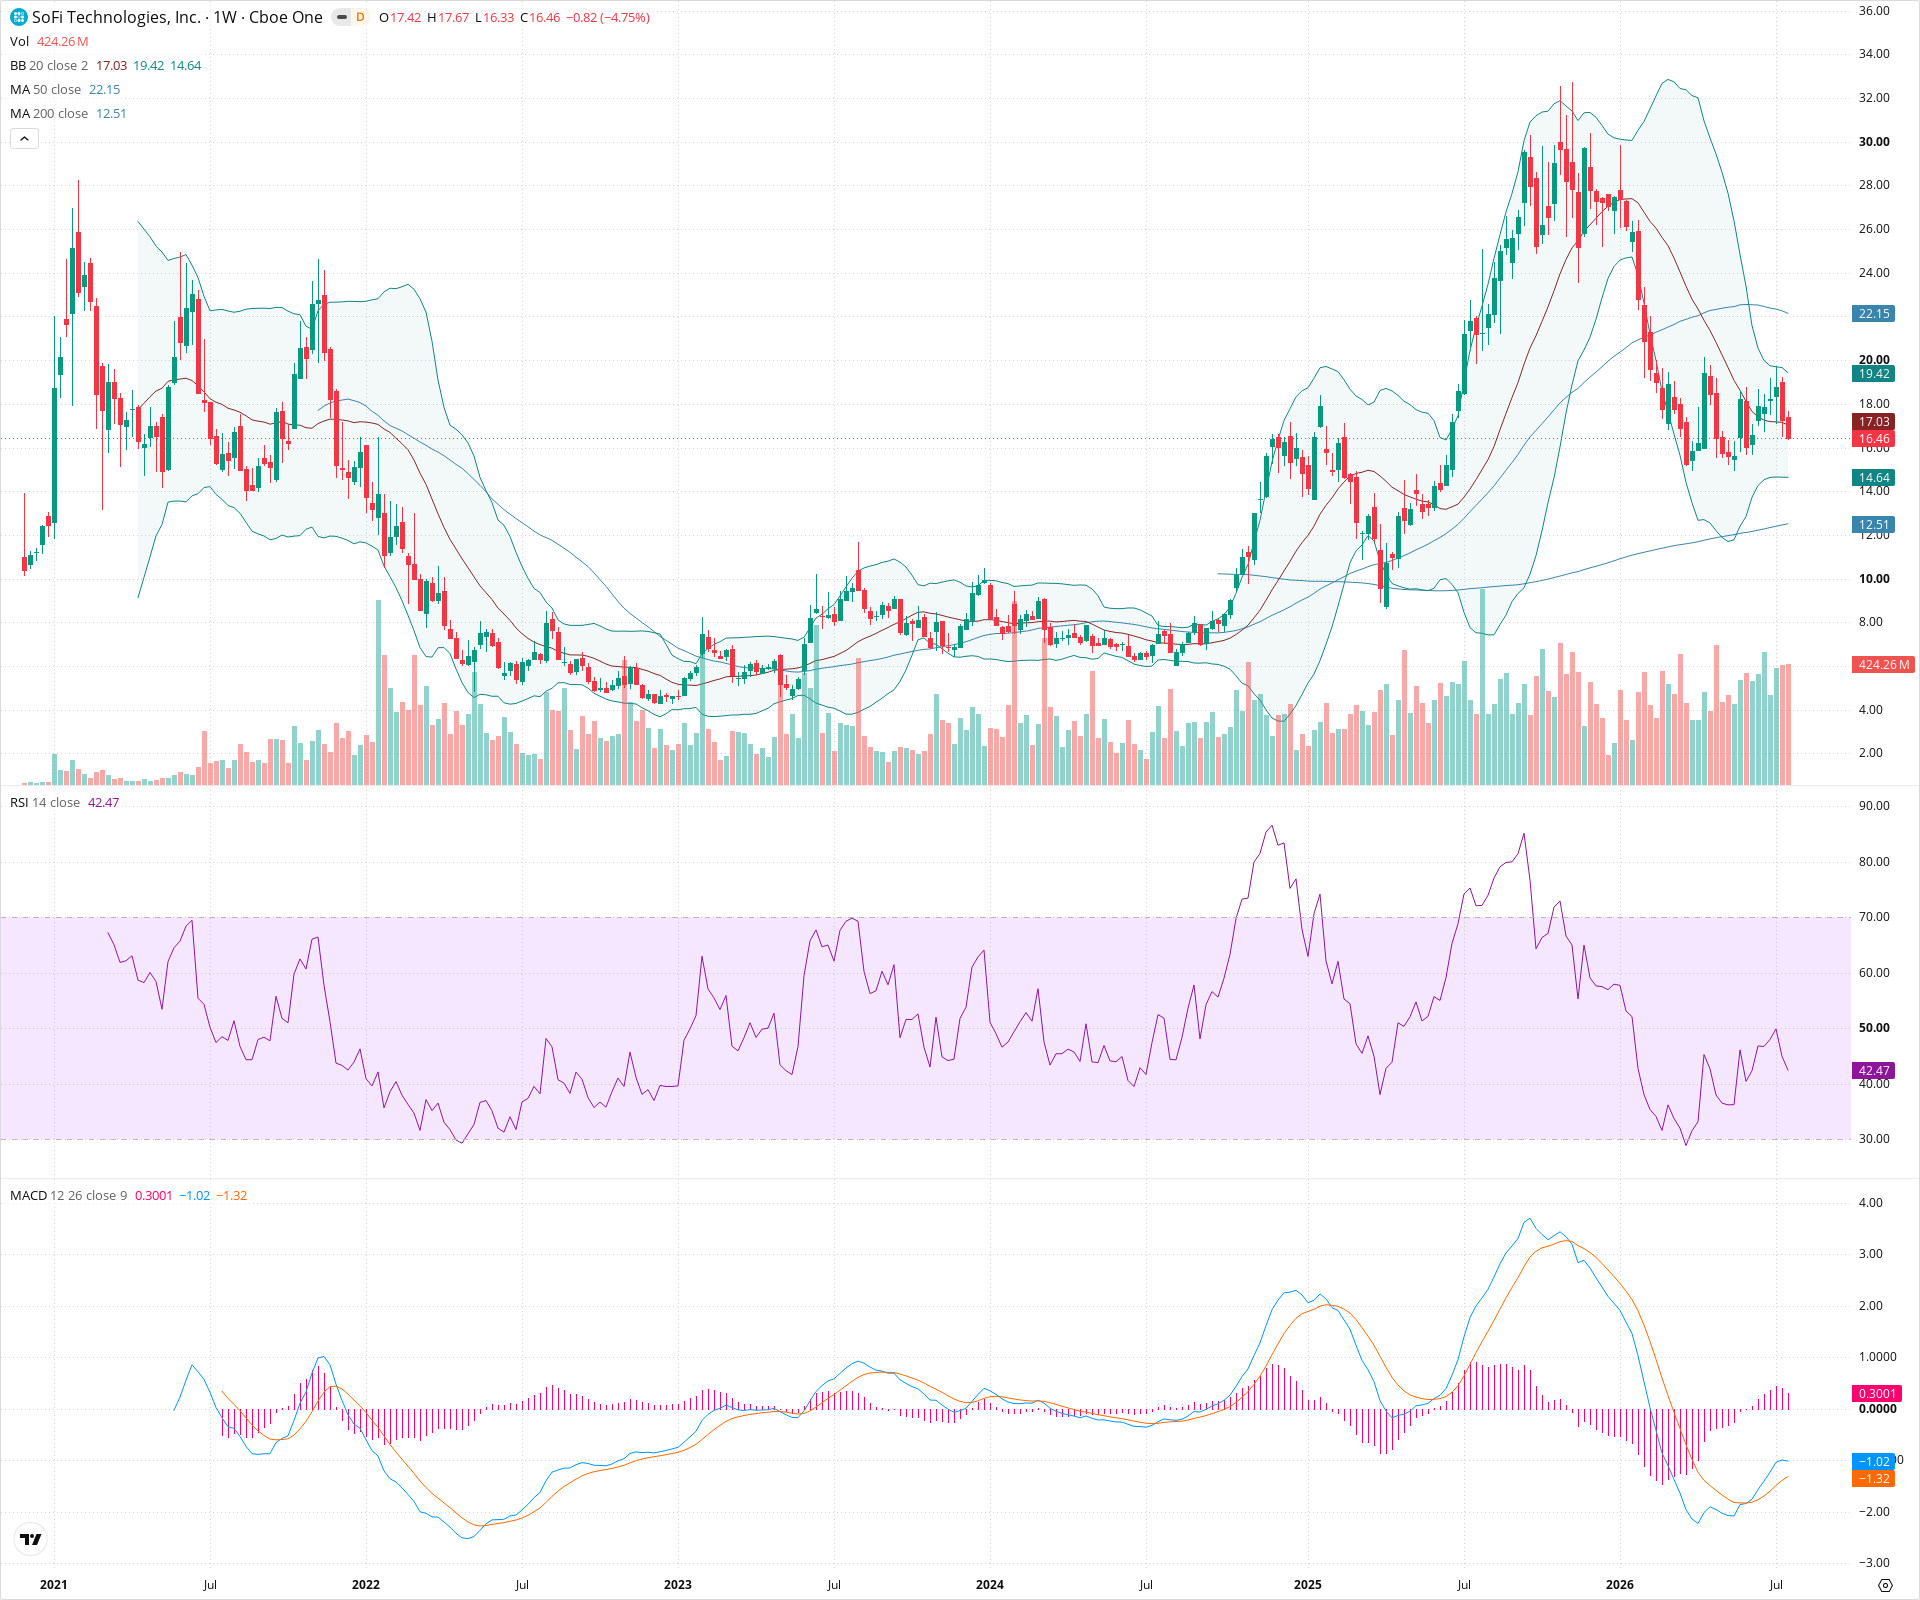
SOFI is currently mired in a significant multi-month downtrend on the weekly chart, having retraced sharply from highs near $32. Technical indicators are heavily bearish, with price action occurring below both the 20-week and 50-week SMAs, and RSI dwelling in the lower half of its range. While the MACD histogram shows a slight deceleration in downside momentum, a substantial base needs to be built around current support levels ($14-$15) or the 200-week SMA ($12.50) to suggest any viable long-term trend reversal.
Included In Lists
Related Tickers of Interest
SOFI Weekly Chart
Sentiment
Short-term Sentiment (days to weeks): Bearish
Price is trading below declining 20-week and 50-week SMAs, establishing a clear sequence of lower highs and lower lows from the recent peak. RSI remains below 50 in bearish territory.
Long-term Sentiment (weeks to months): Bearish
The structural trend has broken down significantly from highs near 32. While still above the 200-week SMA, the 50-week SMA is sloping downwards sharply, indicating a dominant longer-term downtrend that requires substantial basing to reverse.
Report Metadata
- Timeframe: weekly
- Generated at: 2026-07-25T09:09:57.102Z
- Model: gemini-3.1-pro-preview
Support Price Levels
| Level | Range | Strength | Notes |
|---|---|---|---|
| $14.50 | $14.00 - $15.00 | Strong | Recent weekly swing low area and visible consolidation zone where buyers recently stepped in. |
| $12.50 | $12.00 - $13.00 | Strong | Major structural support zone coinciding with the 200-week SMA (currently at 12.51) and previous historical consolidation. |
Resistance Price Levels
| Level | Range | Strength | Notes |
|---|---|---|---|
| $19.50 | $19.00 - $20.00 | Strong | Confluence of the declining 20-week SMA (19.42) and psychological round number resistance. |
| $22.50 | $22.00 - $23.00 | Strong | Area around the 50-week SMA (22.15) and structural resistance from prior consolidation during the downtrend. |
Potential Chart Patterns in Formation
| Strength | Pattern | Signal | Target | Details |
|---|---|---|---|---|
| Strong | Downtrend Channel / Sequence of Lower Lows | Bearish | N/A | The stock has formed a persistent series of lower highs and lower lows over multiple months since the peak near 32, defining a clear bearish trend structure. |
Frequently Asked Questions about SOFI
What is the current sentiment for SOFI?
The short-term sentiment for SOFI is currently Bearish because Price is trading below declining 20-week and 50-week SMAs, establishing a clear sequence of lower highs and lower lows from the recent peak. RSI remains below 50 in bearish territory.. The long-term trend is classified as Bearish.
What are the key support levels for SOFI?
StockDips.AI has identified key support levels for SOFI at $14.50 and $12.50. These levels may represent potential accumulation zones where buying interest could emerge.
Is SOFI in a significant dip or a Value Dip right now?
SOFI has a Value Score of 36/100. It is not currently flagged as a significant dip in the Top Dips list. It is not listed as a Value Dip because the long-term sentiment or value-score threshold does not qualify.
View the full interactive analysis on StockDips.AI.