SOFI Monthly Technical Analysis
SoFi Technologies Inc
Fintech offering digital banking, lending, and investing services.
SOFI Technical Analysis Summary
SoFi Technologies has fundamentally shifted its long-term structure by breaking out of a two-year accumulation base, establishing a new secular uptrend supported by rising moving averages and bullish MACD expansion. While the long-term outlook remains positive, the current monthly price action indicates a volatility contraction and mean reversion event as price digests the rapid ascent to $34. Investors should monitor the 20-month SMA near $17 as a critical structural support level for the ongoing bull market.
Included In Lists
Related Tickers of Interest
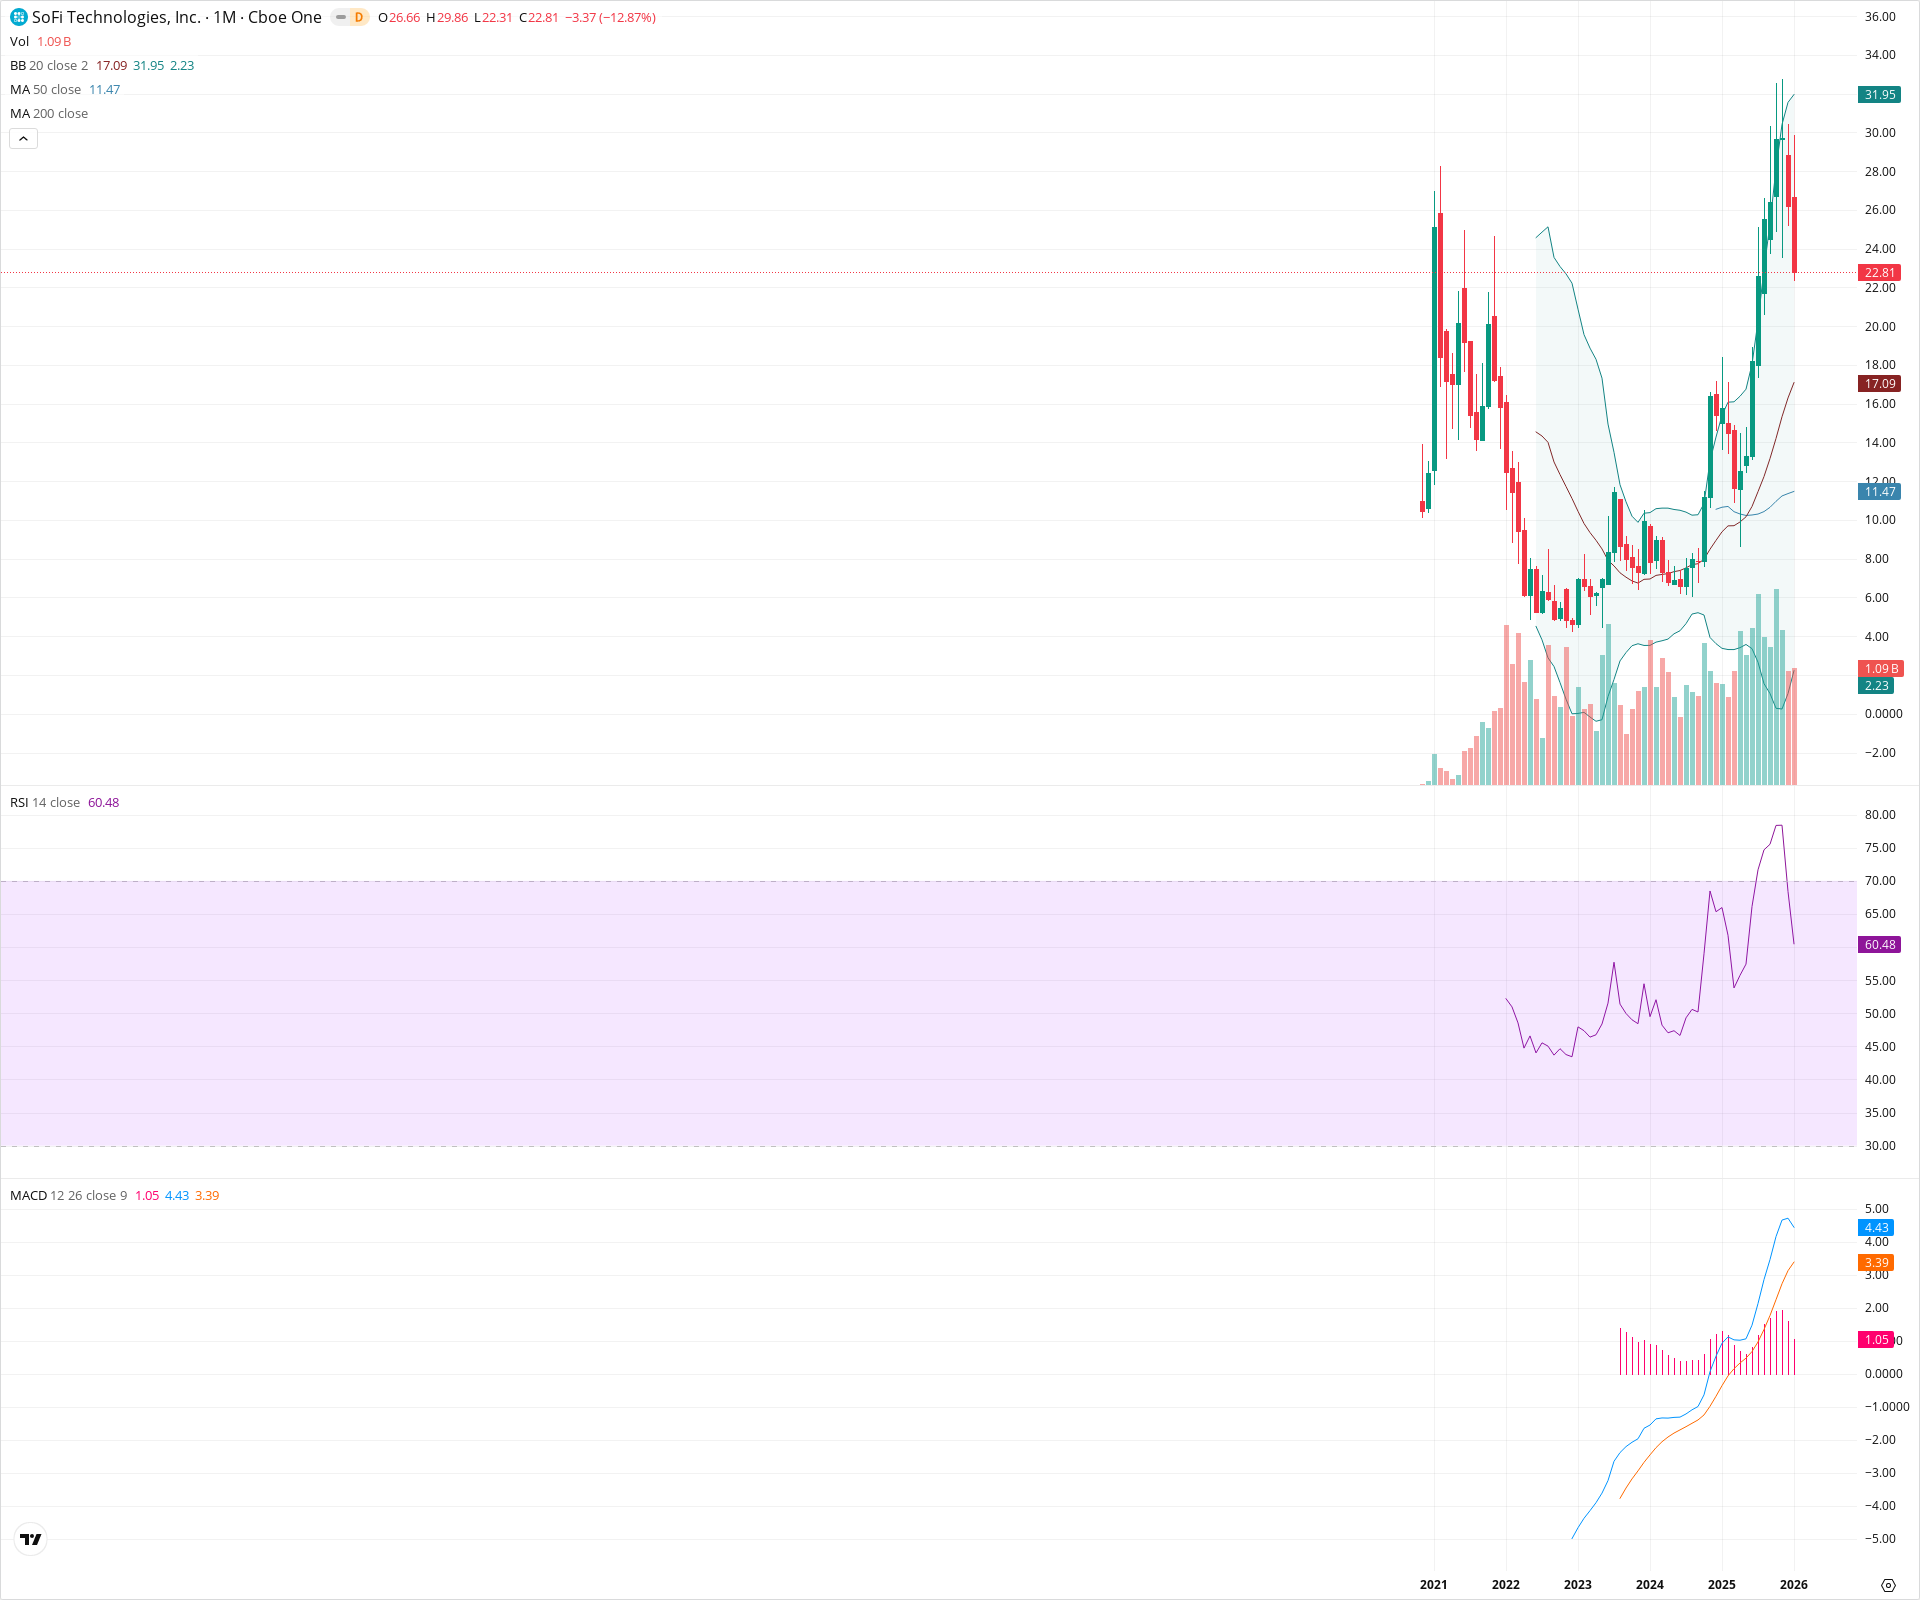
SOFI Monthly Chart
Sentiment
Short-term Sentiment (days to weeks): Neutral
The stock is currently undergoing a sharp correction (-12.87% on the active candle) after a parabolic run-up, indicating a cooling of momentum and potential mean reversion toward the 20-month SMA.
Long-term Sentiment (weeks to months): Bullish
Price has successfully broken out of a multi-year accumulation base (2022-2024). Major moving averages (50 SMA) are sloping up, and the MACD is in a strong positive regime above the zero line.
Report Metadata
- Timeframe: monthly
- Generated at: 2026-02-02T06:58:20.411Z
- Model: gemini-3-pro-preview
Support Price Levels
| Level | Range | Strength | Notes |
|---|---|---|---|
| $17.05 | $17.00 - $17.10 | Strong | Coincides with the 20-month Simple Moving Average (BB basis) and prior consolidation zones. |
| $11.50 | $11.40 - $11.60 | Strong | 50-month SMA and the upper boundary of the multi-year base structure. |
Resistance Price Levels
| Level | Range | Strength | Notes |
|---|---|---|---|
| $29.90 | $29.80 - $30.00 | Weak | Intra-month high of the current pullback candle. |
| $34.00 | $33.50 - $34.50 | Strong | Recent cycle high and major rejection point ending the parabolic advance. |
Potential Chart Patterns in Formation
| Strength | Pattern | Signal | Target | Details |
|---|---|---|---|---|
| Strong | Rounding Bottom / Base Breakout | Bullish | N/A | A massive multi-year base formed between 2022 and 2024 in the $4-$10 range, which resolved with a high-volume breakout leading to the current uptrend. |
Frequently Asked Questions about SOFI
What is the current sentiment for SOFI?
The short-term sentiment for SOFI is currently Neutral because The stock is currently undergoing a sharp correction (-12.87% on the active candle) after a parabolic run-up, indicating a cooling of momentum and potential mean reversion toward the 20-month SMA.. The long-term trend is classified as Bullish.
What are the key support levels for SOFI?
StockDips.AI has identified key support levels for SOFI at $17.05 and $11.50. These levels may represent potential accumulation zones where buying interest could emerge.
Is SOFI in a significant dip or a Value Dip right now?
SOFI has a Value Score of 36/100. It is not currently flagged as a significant dip in the Top Dips list. It is not listed as a Value Dip because the long-term sentiment or value-score threshold does not qualify.
View the full interactive analysis on StockDips.AI.