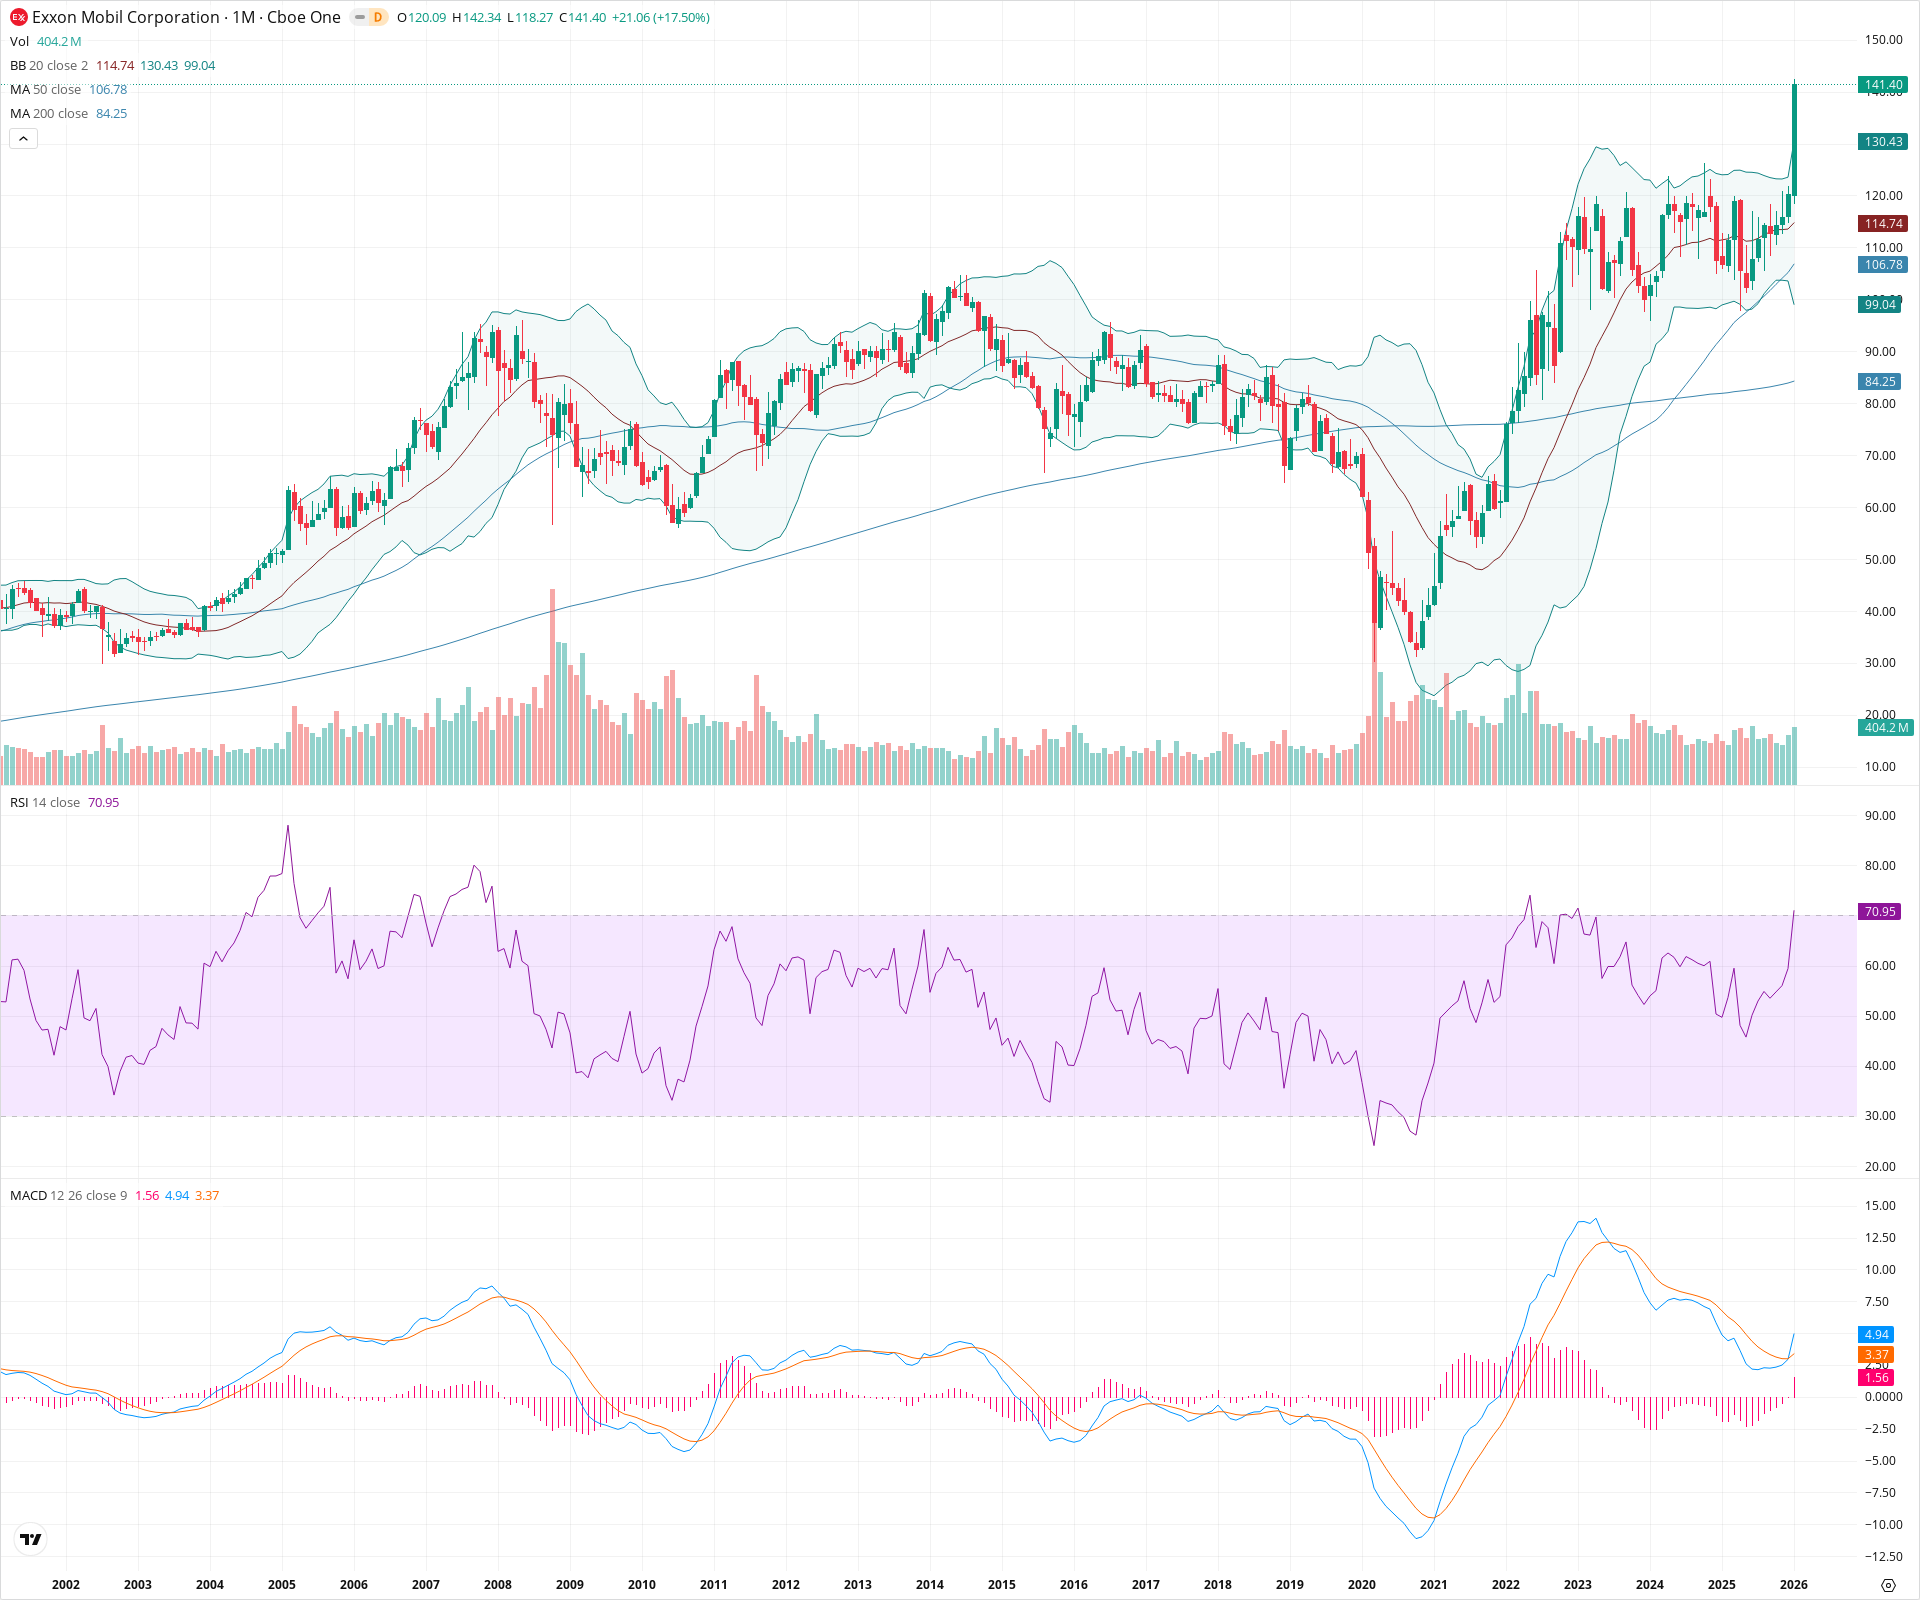
XOM Monthly Technical Analysis
Exxon Mobil Corp.
Multinational oil and gas company engaged in exploration, refining, and chemicals.
XOM Technical Analysis Summary
XOM has confirmed a major bullish breakout to new all-time highs, clearing the critical 120.00 resistance level with significant momentum. The stock is firmly in a secular bull regime, supported by rising long-term moving averages and a bullish MACD crossover. With the price entering discovery mode and RSI signaling strong momentum rather than exhaustion, the path of least resistance remains upward.
Included In Lists
Related Tickers of Interest
XOM Monthly Chart
Sentiment
Short-term Sentiment (days to weeks): Bullish
The current monthly candle is a massive bullish engulfing/breakout candle that has cleared significant multi-year resistance around 120. Momentum is surging with the RSI crossing above 70 and MACD histogram expanding positively.
Long-term Sentiment (weeks to months): Bullish
Price is trading at all-time highs well above rising 50-month and 200-month SMAs. The breakout from a year-long consolidation pattern confirms a continuation of the secular bull trend that began in 2020.
Report Metadata
- Timeframe: monthly
- Generated at: 2026-02-02T06:59:58.010Z
- Model: gemini-3-pro-preview
Support Price Levels
| Level | Range | Strength | Notes |
|---|---|---|---|
| $119.00 | $118.00 - $120.00 | Strong | Former major resistance level (2023 highs) now converted to primary support following the breakout. |
| $103.00 | $100.00 - $106.00 | Strong | Psychological round number and confluence with the rising 50-month SMA and recent consolidation lows. |
| $84.50 | $84.00 - $85.00 | Strong | Long-term structural support aligned with the 200-month moving average. |
Resistance Price Levels
| Level | Range | Strength | Notes |
|---|---|---|---|
| $146.17 | $142.34 - $150.00 | Weak | Current month's high and psychological extension level; the stock is in price discovery mode with no historical overhead supply. |
Potential Chart Patterns in Formation
| Strength | Pattern | Signal | Target | Details |
|---|---|---|---|---|
| Strong | Bullish Consolidation Breakout | Bullish | $160.00 | After a strong run-up, price consolidated sideways between roughly 100 and 120 for over a year. The current candle represents a decisive breakout from this range. |
| Strong | Secular Uptrend (Post-2020) | Bullish | N/A | Since the 2020 lows, the chart exhibits a consistent series of higher highs and higher lows, creating a robust uptrend channel. |
Frequently Asked Questions about XOM
What is the current sentiment for XOM?
The short-term sentiment for XOM is currently Bullish because The current monthly candle is a massive bullish engulfing/breakout candle that has cleared significant multi-year resistance around 120. Momentum is surging with the RSI crossing above 70 and MACD histogram expanding positively.. The long-term trend is classified as Bullish.
What are the key support levels for XOM?
StockDips.AI has identified key support levels for XOM at $119.00 and $103.00. These levels may represent potential accumulation zones where buying interest could emerge.
Is XOM in a significant dip or a Value Dip right now?
XOM has a Value Score of 30/100. It is not currently flagged as a significant dip in the Top Dips list. It is not listed as a Value Dip because the long-term sentiment or value-score threshold does not qualify.
View the full interactive analysis on StockDips.AI.