DOGE Daily Technical Analysis
Dogecoin
A meme-inspired cryptocurrency with a strong community and fast transaction times.
DOGE Technical Analysis Summary
DOGE remains entrenched in a robust, long-term downtrend with price suppressed well below major moving averages. Short-term momentum continues to look weak, though the RSI approaching oversold levels suggests the possibility of minor consolidations or weak relief rallies within the broader bearish structure. The technical picture dictates caution for long-term investors until a major structural break above the 200-day SMA is achieved.
Included In Lists
Related Tickers of Interest
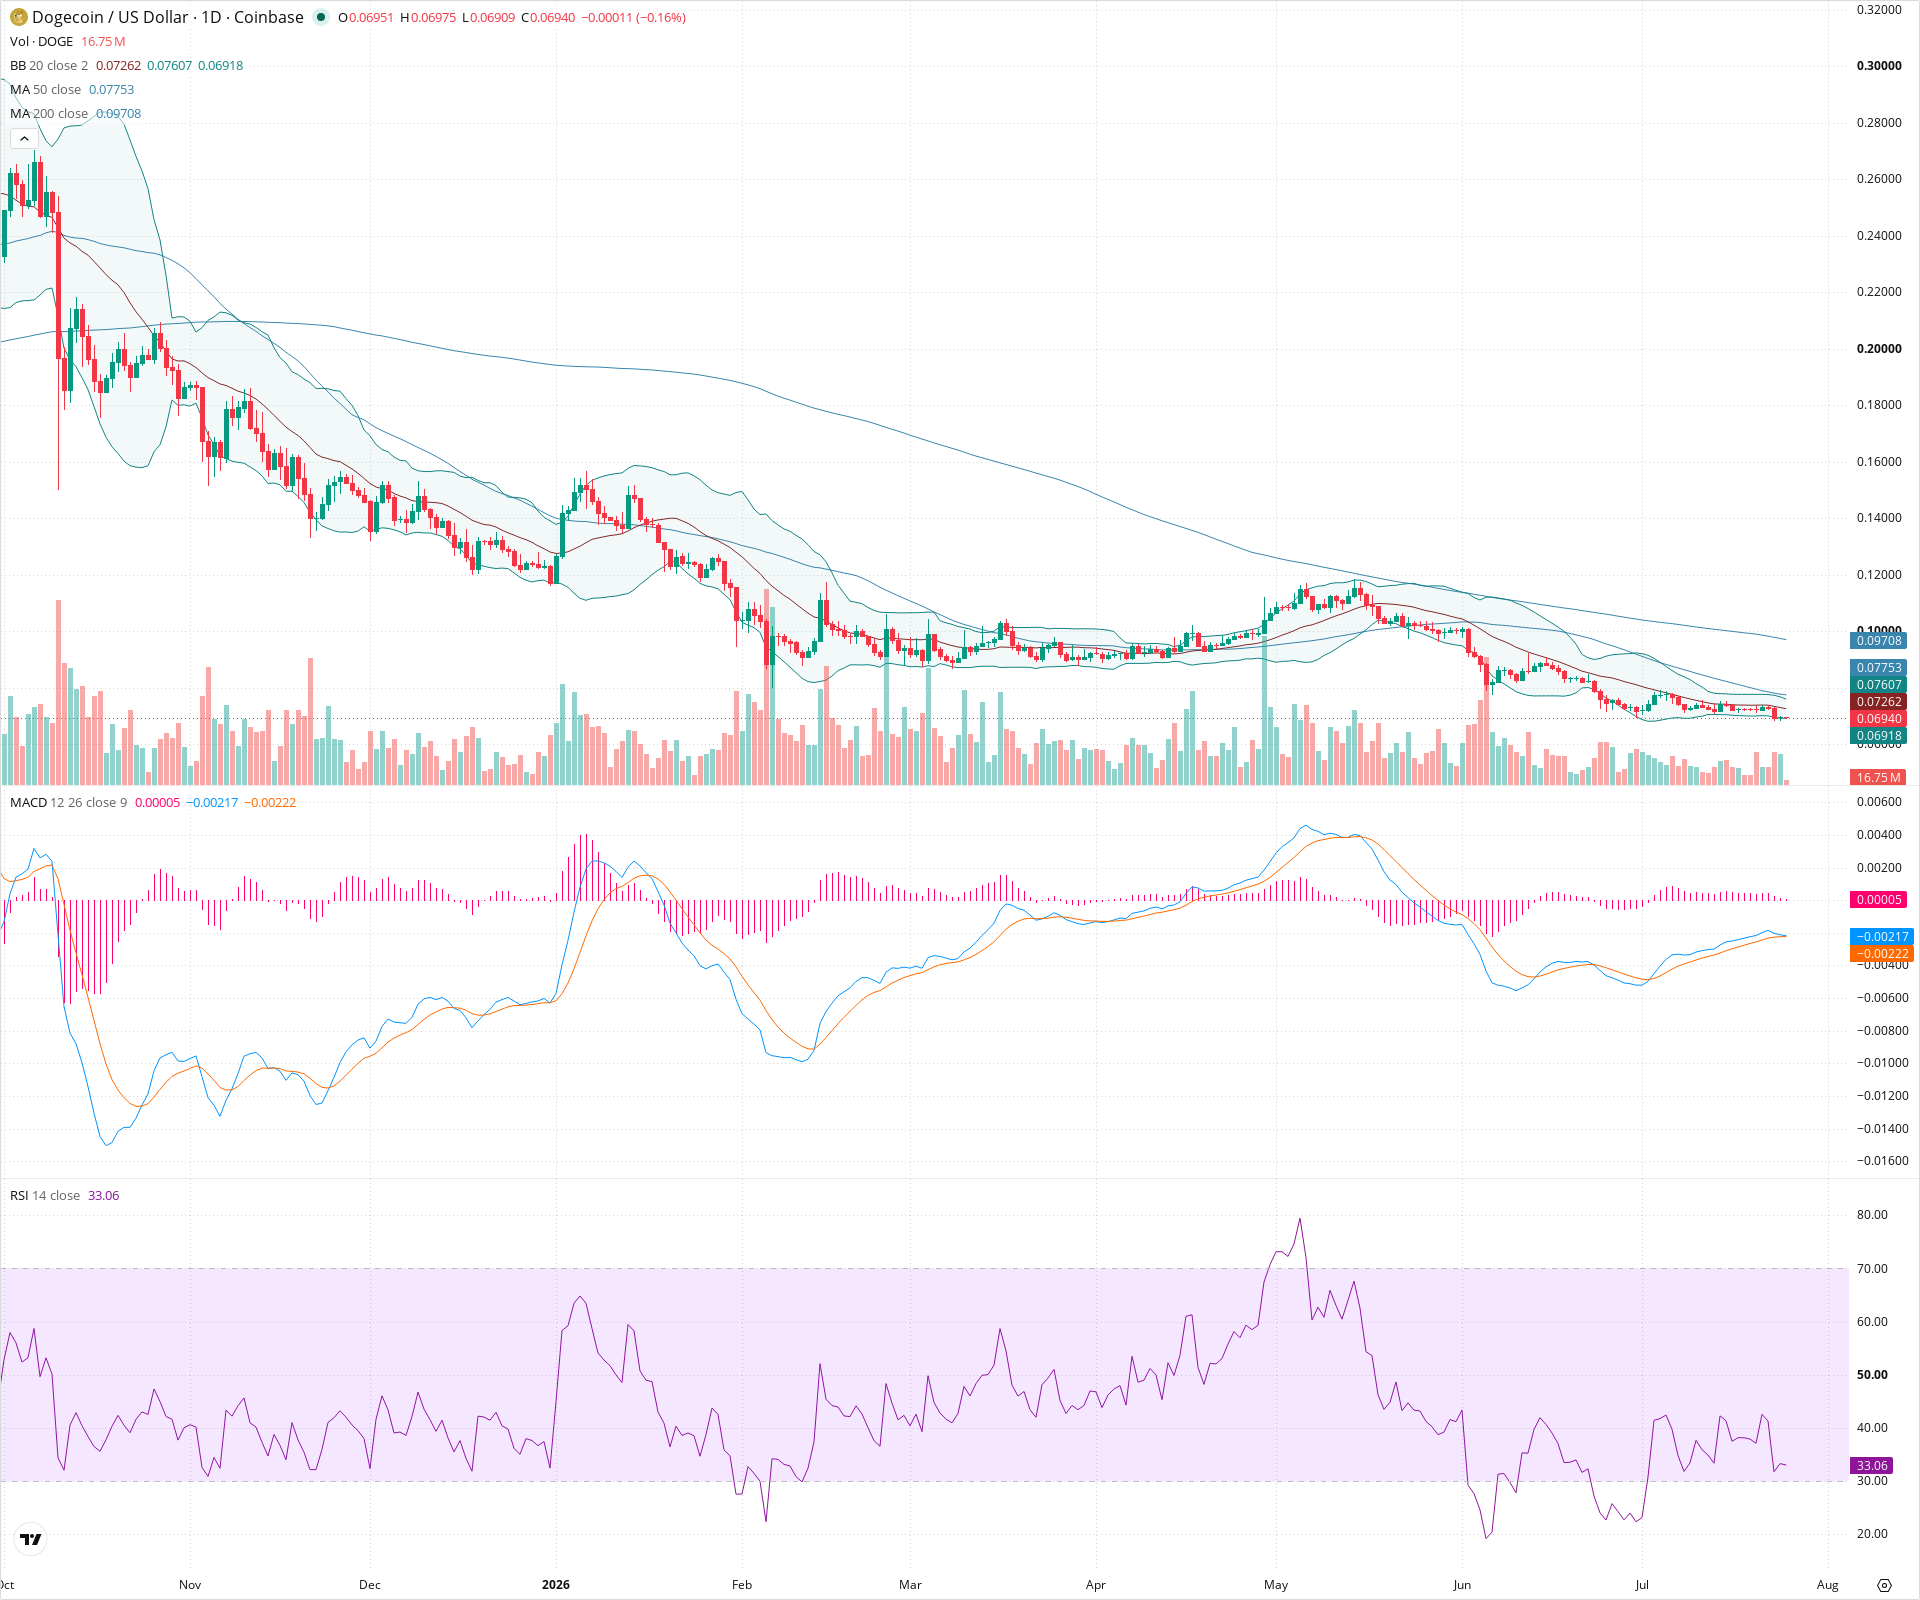
DOGE Daily Chart
Sentiment
Short-term Sentiment (days to weeks): Bearish
Price is trading near the lower Bollinger Band, below the 50-day SMA, with the MACD line below the signal line and in negative territory, indicating downward momentum.
Long-term Sentiment (weeks to months): Bearish
The asset is in a pronounced, long-term downtrend, characterized by consistent lower highs and lower lows, while trading significantly below a declining 200-day SMA.
Report Metadata
- Timeframe: daily
- Generated at: 2026-07-25T12:02:02.101Z
- Model: gemini-3.1-pro-preview
Support Price Levels
| Level | Range | Strength | Notes |
|---|---|---|---|
| $0.06 | $0.05 - $0.06 | Strong | Major swing low from June acting as the most significant visible floor. |
Resistance Price Levels
| Level | Range | Strength | Notes |
|---|---|---|---|
| $0.08 | $0.08 - $0.08 | Strong | Convergence of recent lower high resistance and the descending 50-day SMA. |
| $0.10 | $0.10 - $0.11 | Strong | Major prior resistance zone coinciding with the long-term 200-day SMA. |
Potential Chart Patterns in Formation
| Strength | Pattern | Signal | Target | Details |
|---|---|---|---|---|
| Strong | Descending Channel | Bearish | N/A | Price action is contained within a broad downward channel, consistently making lower highs and lower lows over the long term. |
Frequently Asked Questions about DOGE
What is the current sentiment for DOGE?
The short-term sentiment for DOGE is currently Bearish because Price is trading near the lower Bollinger Band, below the 50-day SMA, with the MACD line below the signal line and in negative territory, indicating downward momentum.. The long-term trend is classified as Bearish.
What are the key support levels for DOGE?
StockDips.AI has identified key support levels for DOGE at $0.06. These levels may represent potential accumulation zones where buying interest could emerge.
Is DOGE in a significant dip or a Value Dip right now?
DOGE has a Value Score of 41/100. It is not currently flagged as a significant dip in the Top Dips list. It is not listed as a Value Dip because the long-term sentiment or value-score threshold does not qualify.
View the full interactive analysis on StockDips.AI.