BNB Weekly Technical Analysis
Binance Coin
Utility token of the Binance ecosystem, used for transaction fees and blockchain operations.
BNB Technical Analysis Summary
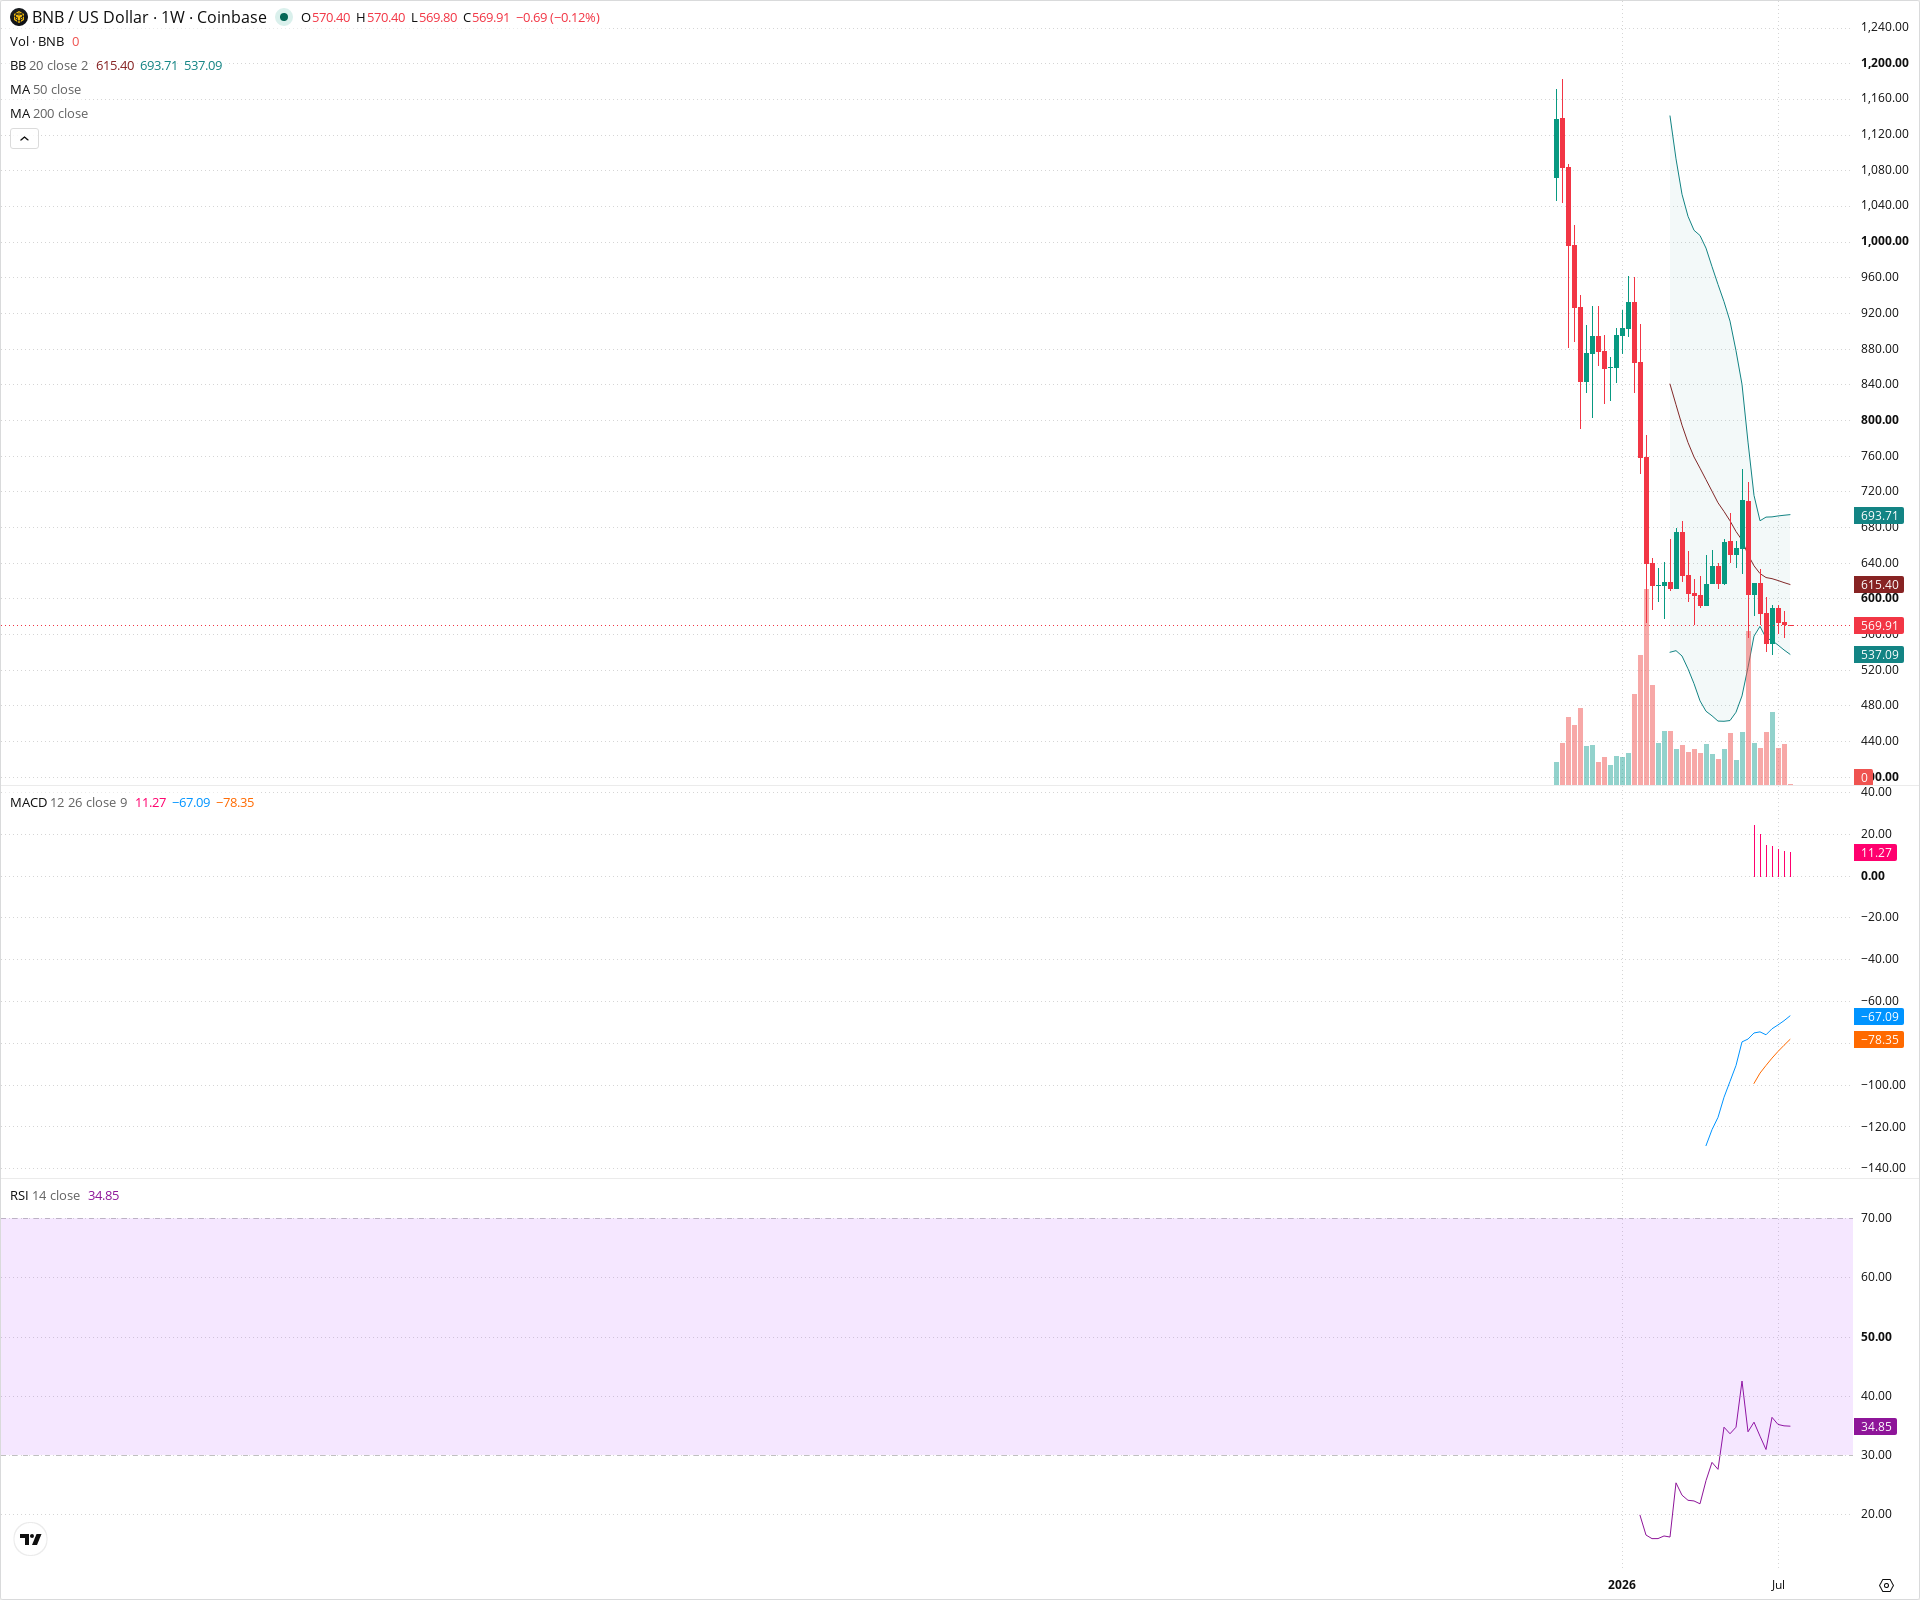
BNB is in a severe long-term downtrend following a catastrophic drop from its all-time highs. Currently, the price is in a multi-week consolidation phase, acting as a potential bear flag. While the MACD indicates slowing downward momentum deep in negative territory, the price remains capped by the 20-week SMA, and the RSI remains weak. A decisive break below the 480-520 support zone would signal a continuation of the macro downtrend.
Included In Lists
Related Tickers of Interest
BNB Weekly Chart
Sentiment
Short-term Sentiment (days to weeks): Bearish
Price is trading below the 20-week SMA, RSI is below 50 and trending downwards, and recent price action shows lower highs within a consolidation range.
Long-term Sentiment (weeks to months): Bearish
The chart shows massive structural damage following a severe crash from highs above $1100. Price remains trapped in a deep consolidation well below prior support levels, indicating a strong macro downtrend.
Report Metadata
- Timeframe: weekly
- Generated at: 2026-07-20T00:03:08.184Z
- Model: gemini-3.1-pro-preview
Support Price Levels
| Level | Range | Strength | Notes |
|---|---|---|---|
| $500.00 | $480.00 - $520.00 | Strong | Major swing low area that halted the initial massive sell-off; significant buyer defense observed here. |
Resistance Price Levels
| Level | Range | Strength | Notes |
|---|---|---|---|
| $620.00 | $600.00 - $640.00 | Strong | Confluence of recent local highs and the declining 20-week SMA. |
| $700.00 | $680.00 - $720.00 | Strong | Top of the current multi-week consolidation range; near the upper Bollinger Band. |
Potential Chart Patterns in Formation
| Strength | Pattern | Signal | Target | Details |
|---|---|---|---|---|
| Strong | Bearish Consolidation / Bear Flag | Bearish | N/A | After a massive vertical drop, price is consolidating sideways in a wide range (approx 500-720). This often acts as a continuation pattern for the prevailing downtrend. |
Frequently Asked Questions about BNB
What is the current sentiment for BNB?
The short-term sentiment for BNB is currently Bearish because Price is trading below the 20-week SMA, RSI is below 50 and trending downwards, and recent price action shows lower highs within a consolidation range.. The long-term trend is classified as Bearish.
What are the key support levels for BNB?
StockDips.AI has identified key support levels for BNB at $500.00. These levels may represent potential accumulation zones where buying interest could emerge.
Is BNB in a significant dip or a Value Dip right now?
BNB has a Value Score of 66/100. It is not currently flagged as a significant dip in the Top Dips list. It is not listed as a Value Dip because the long-term sentiment or value-score threshold does not qualify.
View the full interactive analysis on StockDips.AI.