BNB Monthly Technical Analysis
Binance Coin
Utility token of the Binance ecosystem, used for transaction fees and blockchain operations.
BNB Technical Analysis Summary
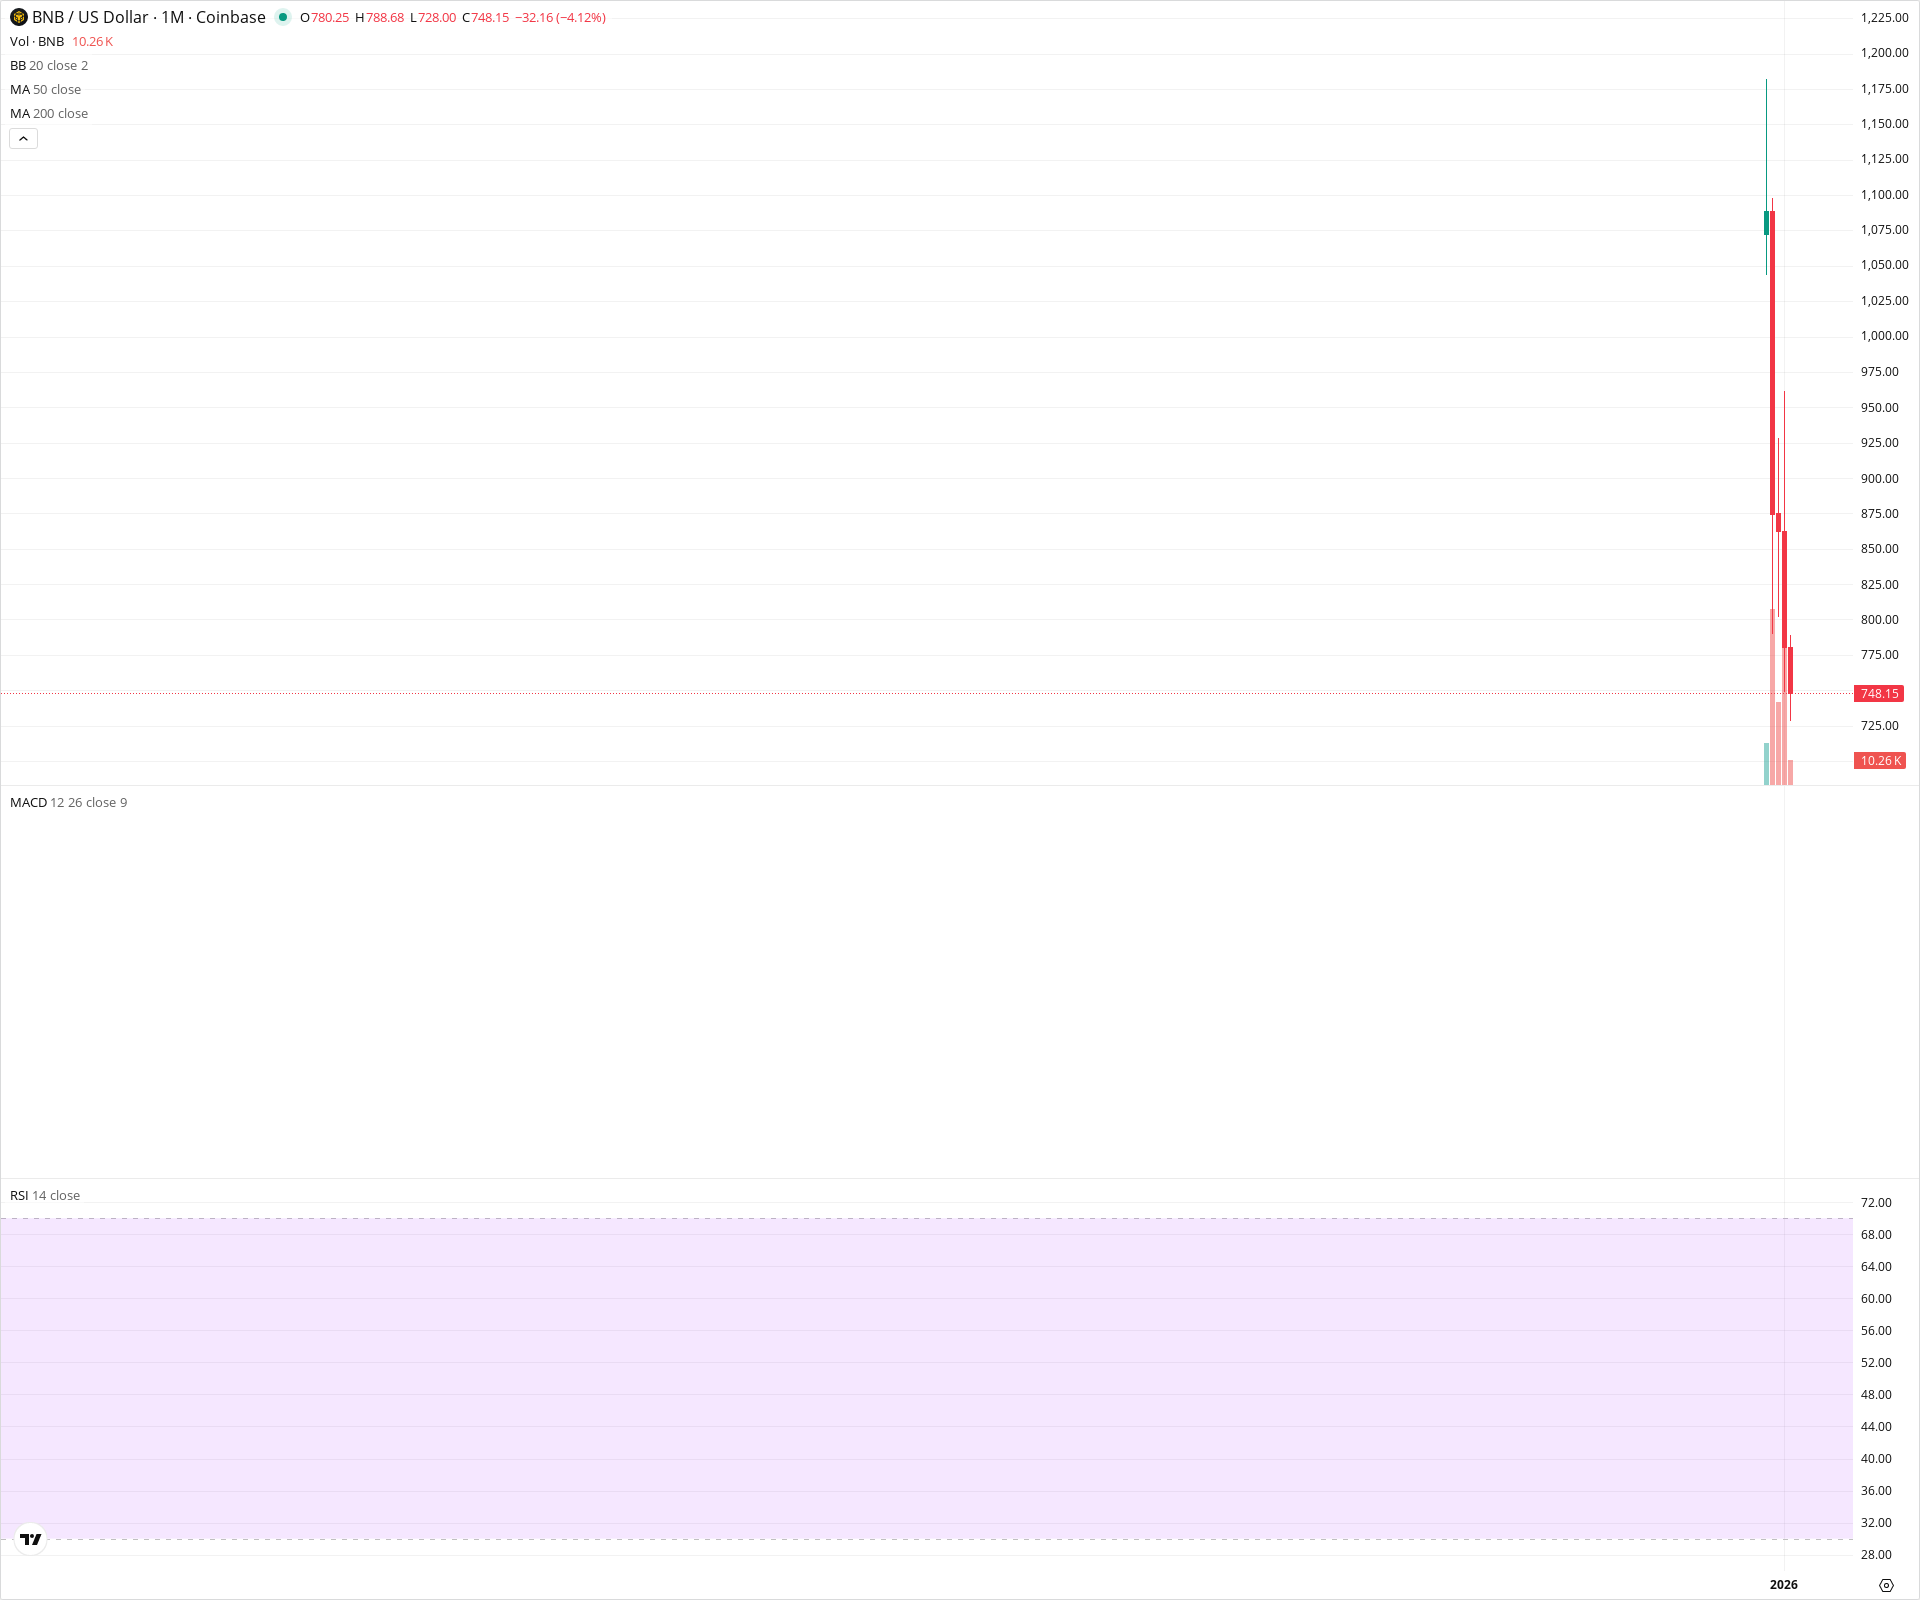
BNB is exhibiting extreme volatility characteristic of a new price discovery phase or a recent listing on this specific feed, with insufficient historical data to populate standard indicators like MACD or RSI. The price action is dominated by a massive bullish impulse to highs near 1,075, followed by a steep correction currently testing the 748 level. While the long-term bias remains structurally bullish due to the magnitude of the breakout, the immediate outlook is defensive as the market seeks a support floor after the rapid ascent.
Included In Lists
Related Tickers of Interest
BNB Monthly Chart
Sentiment
Short-term Sentiment (days to weeks): Bearish
The price is in a sharp correction phase, currently down over 4% for the month after rejecting from highs near 1,075. The formation of a red candle following a volatility spike indicates immediate profit-taking.
Long-term Sentiment (weeks to months): Bullish
Despite the current pullback, the visible market structure shows a massive parabolic breakout impulse. The asset is likely in a price discovery phase, with the prevailing major trend being upward.
Report Metadata
- Timeframe: monthly
- Generated at: 2026-02-02T07:18:39.910Z
- Model: gemini-3-pro-preview
Support Price Levels
| Level | Range | Strength | Notes |
|---|---|---|---|
| $727.50 | $725.00 - $730.00 | Weak | Immediate support defined by the current monthly low (728.00). |
| $600.00 | $580.00 - $620.00 | Strong | Estimated base of the major bullish impulse candle where the vertical move initiated. |
Resistance Price Levels
| Level | Range | Strength | Notes |
|---|---|---|---|
| $785.00 | $780.00 - $790.00 | Weak | Current monthly opening price acting as immediate resistance to recovery. |
| $1,075.00 | $1,070.00 - $1,080.00 | Strong | The visible all-time high and rejection point (approx. 1,075). |
Potential Chart Patterns in Formation
| Strength | Pattern | Signal | Target | Details |
|---|---|---|---|---|
| Strong | Parabolic Spike and Correction | Bearish | N/A | A massive vertical appreciation in price followed by a sharp pullback, typical of a 'blow-off top' or volatile price discovery phase. |
Frequently Asked Questions about BNB
What is the current sentiment for BNB?
The short-term sentiment for BNB is currently Bearish because The price is in a sharp correction phase, currently down over 4% for the month after rejecting from highs near 1,075. The formation of a red candle following a volatility spike indicates immediate profit-taking.. The long-term trend is classified as Bullish.
What are the key support levels for BNB?
StockDips.AI has identified key support levels for BNB at $727.50 and $600.00. These levels may represent potential accumulation zones where buying interest could emerge.
Is BNB in a significant dip or a Value Dip right now?
BNB has a Value Score of 69/100. It is not currently flagged as a significant dip in the Top Dips list. It is not listed as a Value Dip because the long-term sentiment or value-score threshold does not qualify.
View the full interactive analysis on StockDips.AI.