BRK.B Weekly Technical Analysis
Berkshire Hathaway
A diversified global conglomerate spanning insurance, railroads, energy, and consumer brands.
BRK.B Technical Analysis Summary
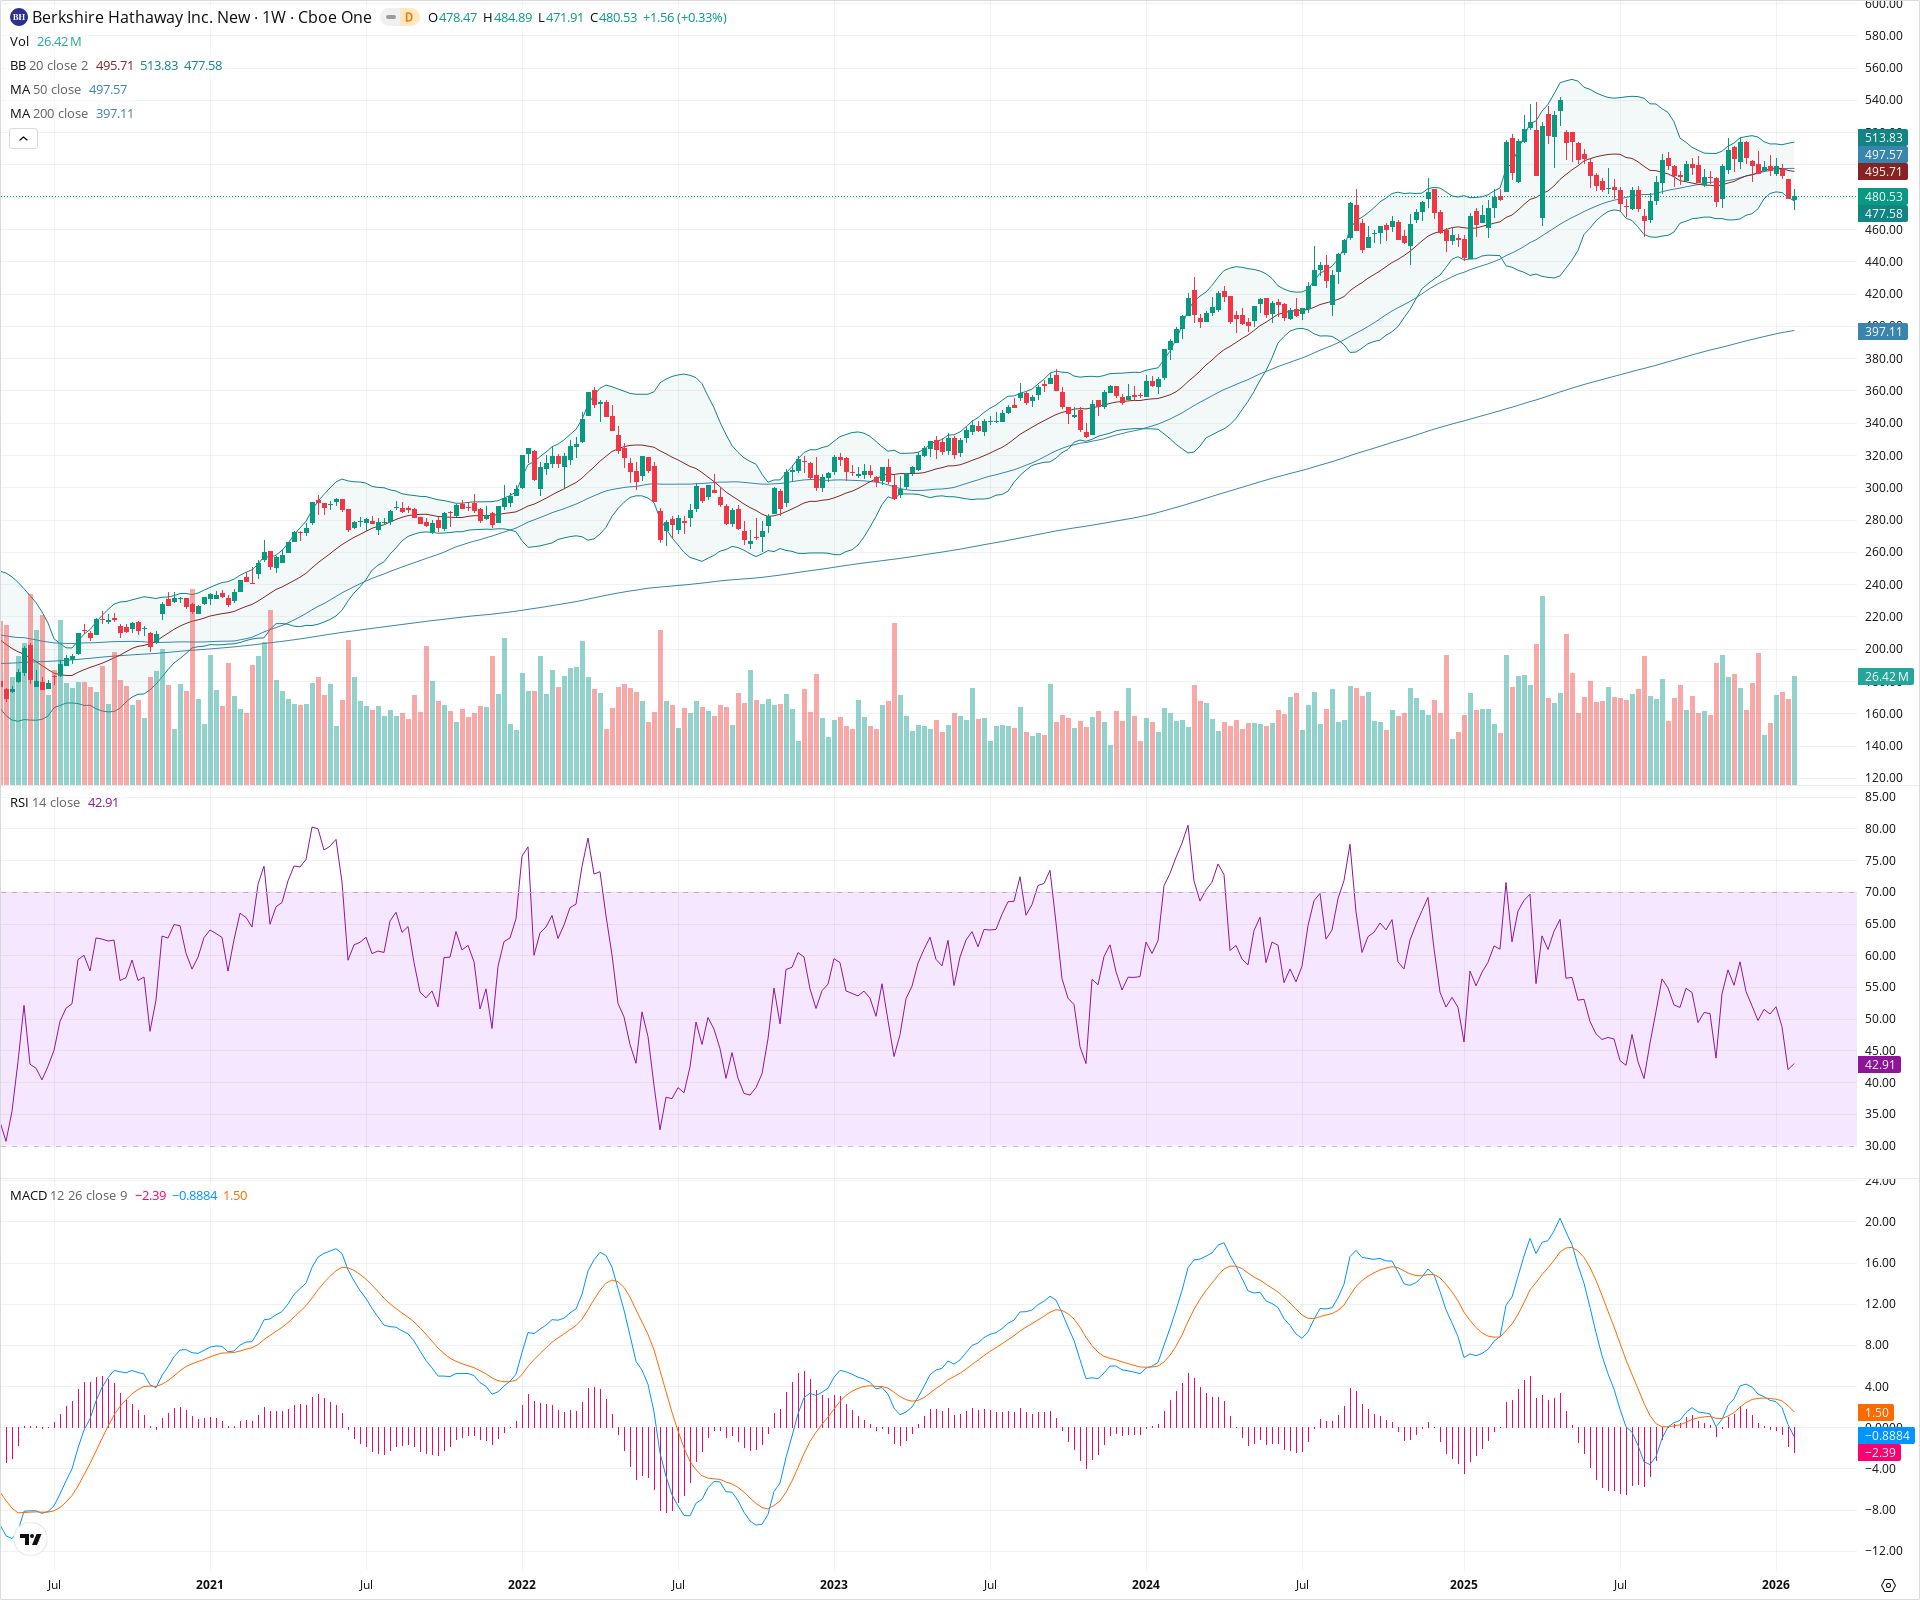
BRK.B is currently undergoing an intermediate correction, having lost support at the 20-week and 50-week SMAs with bearish momentum confirmation from the MACD. While short-term pressure is downward toward the lower Bollinger Band support near 477, the long-term structural trend remains bullish as price holds firmly above the rising 200-week SMA. A decisive close back above 500 would be required to negate the current bearish corrective phase.
Included In Lists
Related Tickers of Interest
BRK.B Weekly Chart
Sentiment
Short-term Sentiment (days to weeks): Bearish
Price is trading below the 20-week and 50-week SMAs, MACD is negative, and RSI is in bearish territory below 50.
Long-term Sentiment (weeks to months): Bullish
The stock remains in a primary uptrend, trading well above the rising 200-week SMA.
Report Metadata
- Timeframe: weekly
- Generated at: 2026-01-31T23:29:38.688Z
- Model: gemini-3-pro-preview
Support Price Levels
| Level | Range | Strength | Notes |
|---|---|---|---|
| $475.00 | $470.00 - $480.00 | Strong | Immediate support zone aligned with the lower Bollinger Band and previous consolidation area from early 2024. |
| $437.50 | $430.00 - $445.00 | Strong | Major swing low from late 2023 acting as significant structural support. |
Resistance Price Levels
| Level | Range | Strength | Notes |
|---|---|---|---|
| $497.50 | $495.00 - $500.00 | Strong | Confluence of the 20-week and 50-week SMAs acting as dynamic resistance. |
| $557.50 | $550.00 - $565.00 | Strong | Recent all-time high zone. |
Potential Chart Patterns in Formation
| Strength | Pattern | Signal | Target | Details |
|---|---|---|---|---|
| Weak | Correction / Pullback | Bearish | N/A | Price has retraced from recent highs and broken below intermediate moving averages. |
| Weak | Rounding Top | Bearish | $440.00 | A gradual shift from uptrend to downtrend visible over the last few months, capped by lower highs. |
Frequently Asked Questions about BRK.B
What is the current sentiment for BRK.B?
The short-term sentiment for BRK.B is currently Bearish because Price is trading below the 20-week and 50-week SMAs, MACD is negative, and RSI is in bearish territory below 50.. The long-term trend is classified as Bullish.
What are the key support levels for BRK.B?
StockDips.AI has identified key support levels for BRK.B at $475.00 and $437.50. These levels may represent potential accumulation zones where buying interest could emerge.
Is BRK.B in a significant dip or a Value Dip right now?
BRK.B has a Value Score of -38/100. It is currently flagged as a significant dip in the Top Dips list. It is also listed as a Value Dip because long-term sentiment is bullish.
View the full interactive analysis on StockDips.AI.