BRK.B Monthly Technical Analysis
Berkshire Hathaway
A diversified global conglomerate spanning insurance, railroads, energy, and consumer brands.
BRK.B Technical Analysis Summary
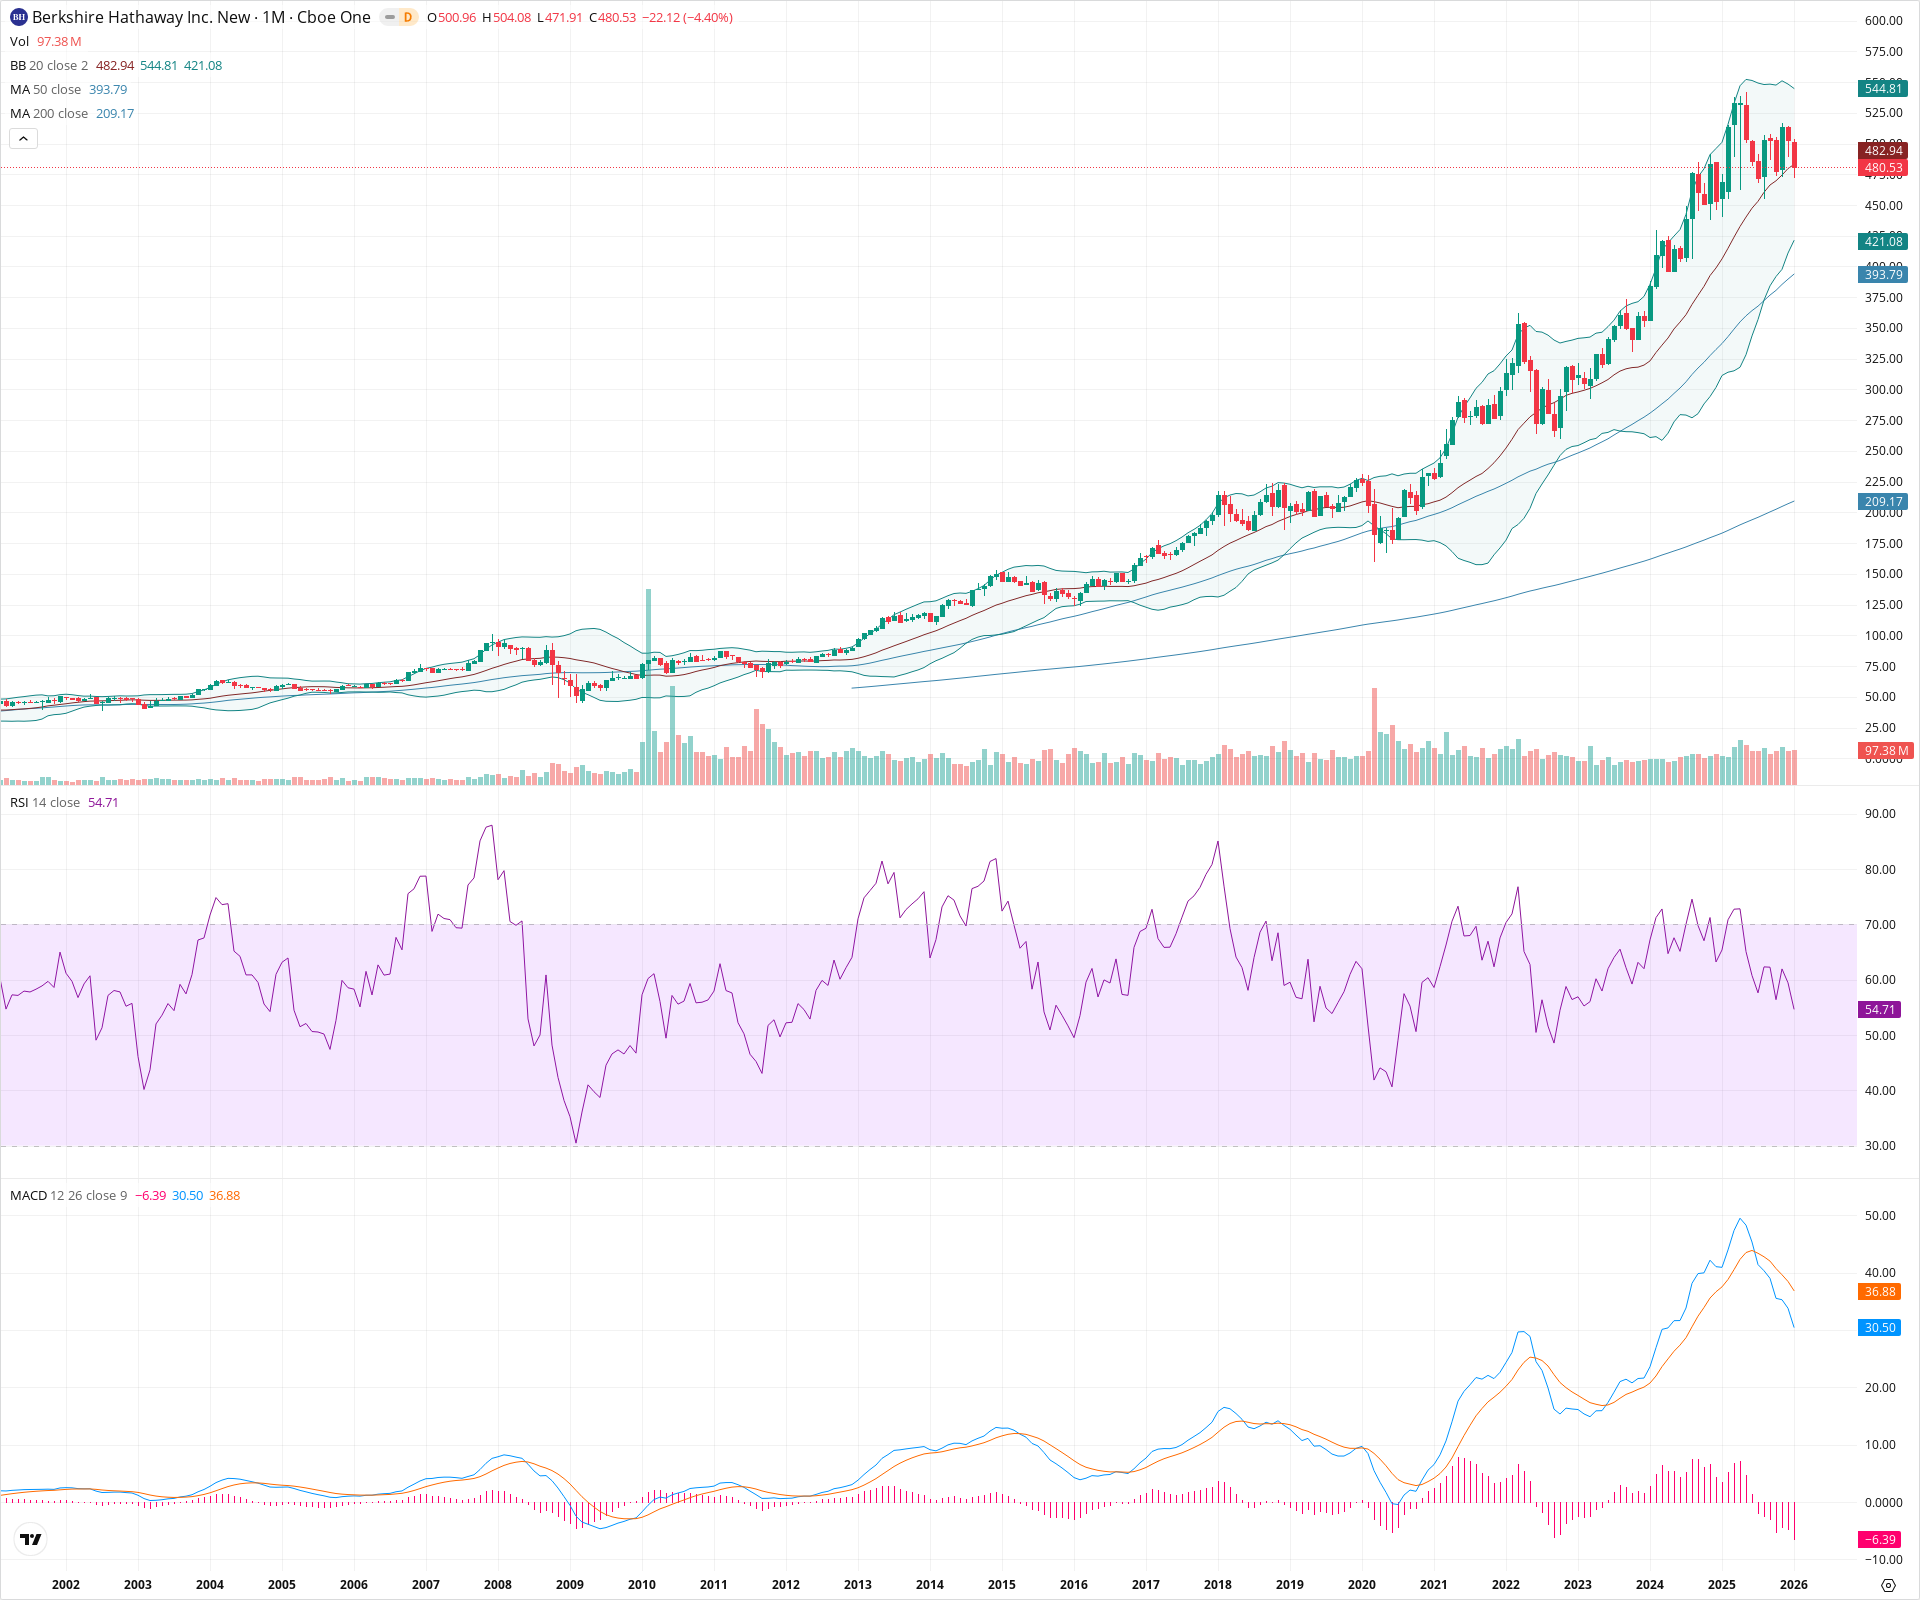
Berkshire Hathaway remains in a powerful secular bull market, evidenced by the rising 50 and 200-month moving averages. However, the recent bearish crossover on the monthly MACD and the pullback below the 20-month SMA suggest a medium-term consolidation or corrective phase is active. Investors should monitor whether the price can reclaim the 20 SMA or if it seeks deeper liquidity near the 50-month SMA around 390-400.
Included In Lists
Related Tickers of Interest
BRK.B Monthly Chart
Sentiment
Short-term Sentiment (days to weeks): Bearish
Price has pulled back sharply from recent highs, closing below the 20-month SMA with a bearish MACD crossover indicating negative momentum.
Long-term Sentiment (weeks to months): Bullish
The secular trend remains intact with price positioned well above the rising 50-month and 200-month SMAs, showing a classic long-term uptrend structure.
Report Metadata
- Timeframe: monthly
- Generated at: 2026-02-02T05:32:31.110Z
- Model: gemini-3-pro-preview
Support Price Levels
| Level | Range | Strength | Notes |
|---|---|---|---|
| $476.50 | $470.00 - $483.00 | Weak | Current testing zone around the 20-month SMA and recent monthly lows. |
| $395.00 | $390.00 - $400.00 | Strong | Confluence of the rising 50-month SMA and psychological support. |
| $357.50 | $350.00 - $365.00 | Strong | Major structural breakout zone from the 2022-2023 consolidation highs. |
Resistance Price Levels
| Level | Range | Strength | Notes |
|---|---|---|---|
| $567.50 | $560.00 - $575.00 | Strong | Recent all-time high zone and upper Bollinger Band extension. |
| $600.00 | $600.00 - $600.00 | Weak | Psychological round number resistance. |
Potential Chart Patterns in Formation
| Strength | Pattern | Signal | Target | Details |
|---|---|---|---|---|
| Strong | Parabolic Advance | Neutral | N/A | Steep multi-year price acceleration separating far from the long-term mean. |
| Weak | Mean Reversion | Bearish | $393.79 | Current pullback correcting the over-extension back towards moving average support. |
Frequently Asked Questions about BRK.B
What is the current sentiment for BRK.B?
The short-term sentiment for BRK.B is currently Bearish because Price has pulled back sharply from recent highs, closing below the 20-month SMA with a bearish MACD crossover indicating negative momentum.. The long-term trend is classified as Bullish.
What are the key support levels for BRK.B?
StockDips.AI has identified key support levels for BRK.B at $476.50 and $395.00. These levels may represent potential accumulation zones where buying interest could emerge.
Is BRK.B in a significant dip or a Value Dip right now?
BRK.B has a Value Score of -38/100. It is currently flagged as a significant dip in the Top Dips list. It is also listed as a Value Dip because long-term sentiment is bullish.
View the full interactive analysis on StockDips.AI.