BTC Weekly Technical Analysis
Bitcoin
The first and largest cryptocurrency, created as decentralized digital money with a capped supply of 21 million coins.
BTC Technical Analysis Summary
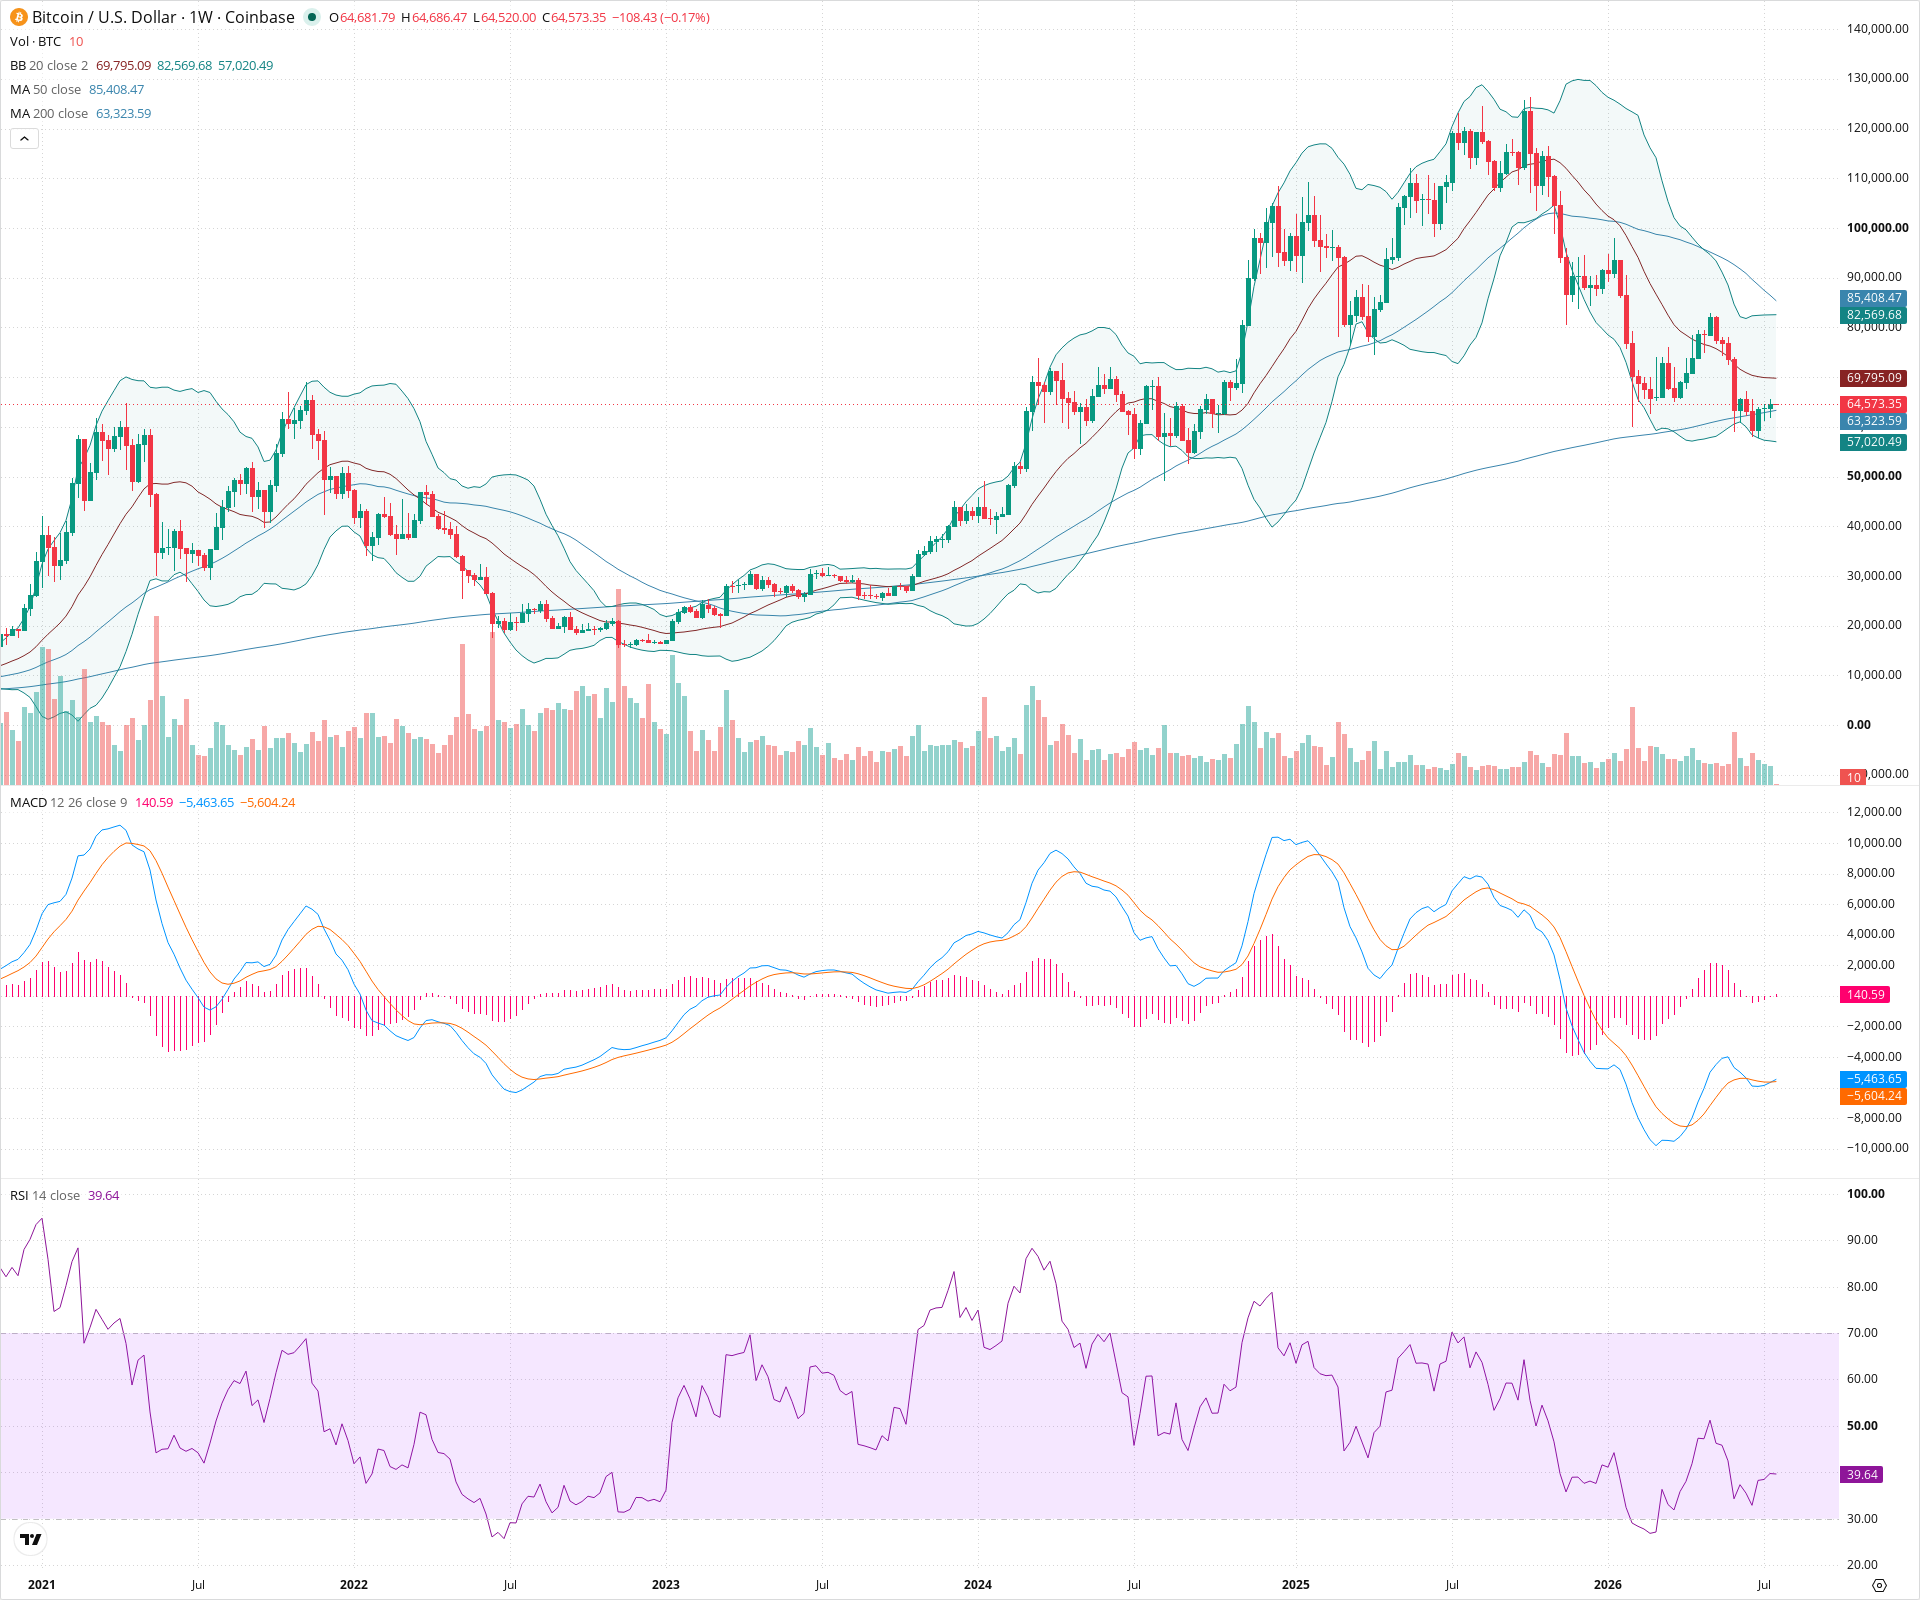
Bitcoin is currently undergoing a medium-term corrective phase, digesting the massive gains from late 2023 and early 2024. Price is currently testing a pivotal support zone near the 50-week SMA, attempting to establish a higher low relative to the broader uptrend. While short-term momentum indicators like MACD remain in bearish territory, they show early signs of flattening. The long-term trend remains firmly bullish as long as critical structural support in the 56k-58k region holds.
Included In Lists
Related Tickers of Interest
BTC Weekly Chart
Sentiment
Short-term Sentiment (days to weeks): Neutral
Price is consolidating after a significant correction, currently resting near the 50-week SMA. While MACD is negative, downward momentum appears to be decelerating, and RSI is attempting to bounce from lower levels.
Long-term Sentiment (weeks to months): Bullish
The macro structure remains structurally bullish with the 50-week SMA positioned well above the rising 200-week SMA. The current pullback is testing logical medium-term support levels within a broader upward trend.
Report Metadata
- Timeframe: weekly
- Generated at: 2026-07-20T00:03:57.029Z
- Model: gemini-3.1-pro-preview
Support Price Levels
| Level | Range | Strength | Notes |
|---|---|---|---|
| $61,750.00 | $60,000.00 - $63,500.00 | Strong | Immediate support zone encompassing psychological level and the rising 50-week SMA, which has historically acted as dynamic support. |
| $57,250.00 | $56,000.00 - $58,500.00 | Strong | Crucial structural support defined by recent swing lows; a breakdown here would significantly damage the medium-term bullish structure. |
Resistance Price Levels
| Level | Range | Strength | Notes |
|---|---|---|---|
| $70,000.00 | $68,000.00 - $72,000.00 | Strong | Zone of recent lower highs forming the upper boundary of the current consolidation phase. |
| $74,250.00 | $73,500.00 - $75,000.00 | Strong | All-time high resistance zone; breaking above this is required for trend continuation. |
Potential Chart Patterns in Formation
| Strength | Pattern | Signal | Target | Details |
|---|---|---|---|---|
| Strong | Macro Consolidation / Descending Channel | Neutral | N/A | Since peaking, price has formed a series of lower highs and lower lows, characteristic of a corrective phase or large bull flag following a massive run-up. |
Frequently Asked Questions about BTC
What is the current sentiment for BTC?
The short-term sentiment for BTC is currently Neutral because Price is consolidating after a significant correction, currently resting near the 50-week SMA. While MACD is negative, downward momentum appears to be decelerating, and RSI is attempting to bounce from lower levels.. The long-term trend is classified as Bullish.
What are the key support levels for BTC?
StockDips.AI has identified key support levels for BTC at $61,750.00 and $57,250.00. These levels may represent potential accumulation zones where buying interest could emerge.
Is BTC in a significant dip or a Value Dip right now?
BTC has a Value Score of 54/100. It is not currently flagged as a significant dip in the Top Dips list. It is not listed as a Value Dip because the long-term sentiment or value-score threshold does not qualify.
View the full interactive analysis on StockDips.AI.