BTC Monthly Technical Analysis
Bitcoin
The first and largest cryptocurrency, created as decentralized digital money with a capped supply of 21 million coins.
BTC Technical Analysis Summary
Bitcoin is currently in a medium-term corrective phase within a macro bull market, evidenced by a bearish monthly MACD crossover and price action trading below the 20-month SMA. However, the long-term structure remains constructive as long as the price maintains support above the 2021 breakout zone (approx. 60k-69k) and the rising 50-month SMA. This setup suggests a potential period of consolidation or 'retest' before trend resumption.
Included In Lists
Related Tickers of Interest
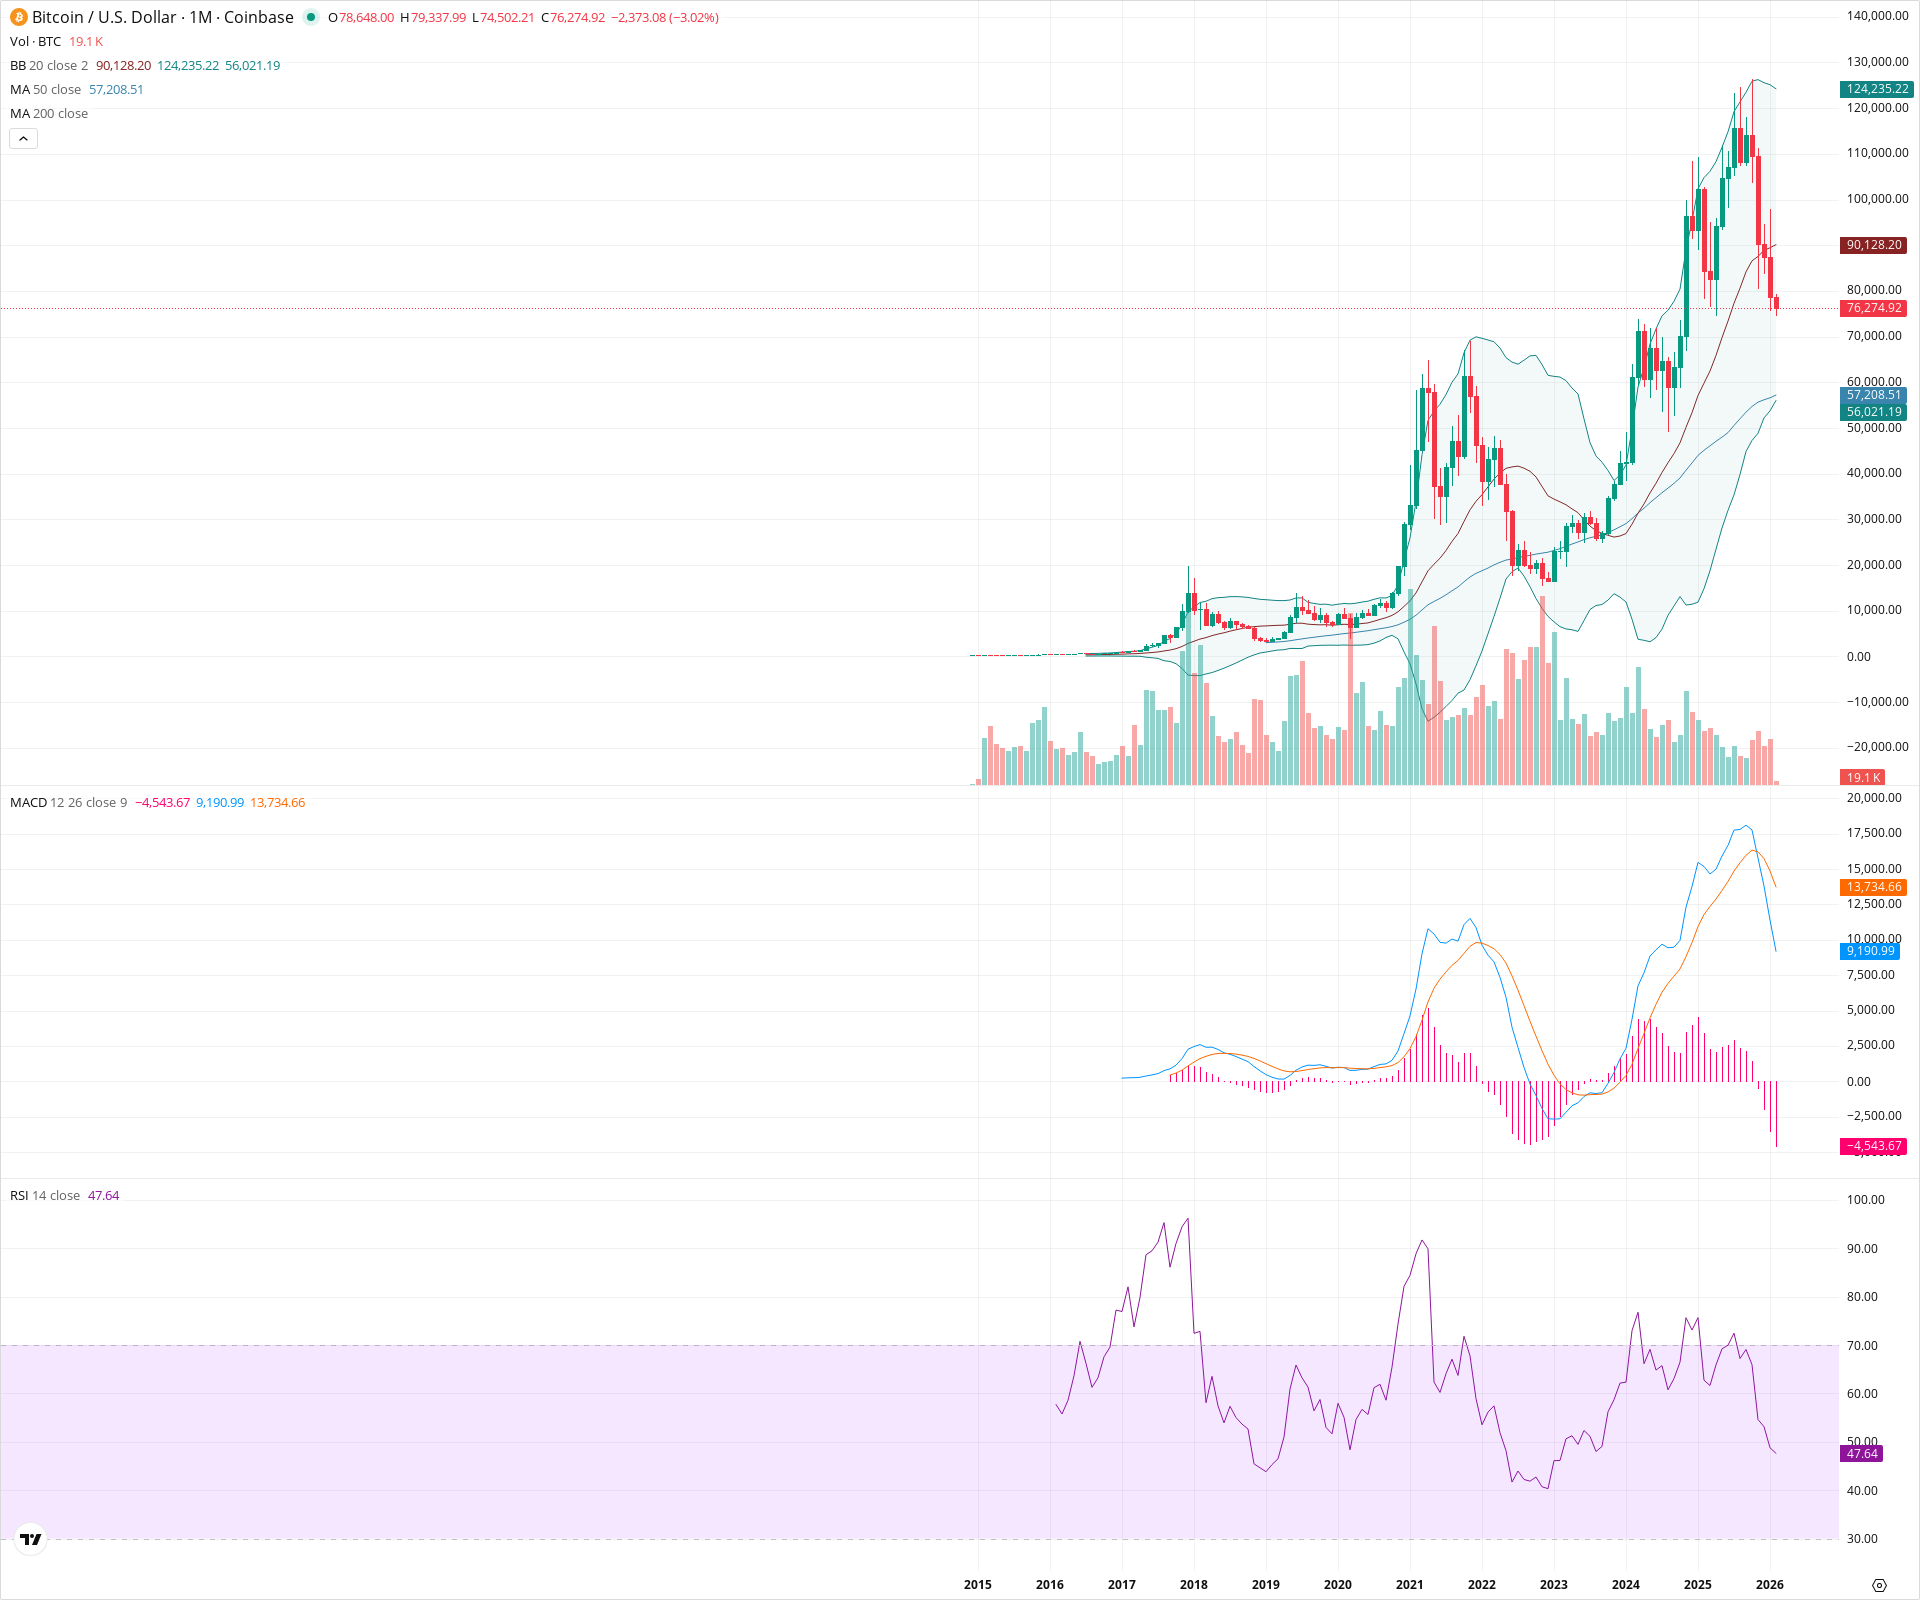
BTC Monthly Chart
Sentiment
Short-term Sentiment (days to weeks): Bearish
Price has fallen below the 20-month SMA (90,128) and the MACD has confirmed a bearish crossover with a negative histogram (-4,543). RSI has dropped to neutral territory (47.64), indicating fading bullish momentum.
Long-term Sentiment (weeks to months): Bullish
The secular trend remains upward with price holding above the 50-month SMA (57,208) and the structural breakout zone of the 2021 all-time highs (~69,000). The current move is technically a retest of previous major resistance turned support.
Report Metadata
- Timeframe: monthly
- Generated at: 2026-02-02T07:19:01.712Z
- Model: gemini-3-pro-preview
Support Price Levels
| Level | Range | Strength | Notes |
|---|---|---|---|
| $64,500.00 | $60,000.00 - $69,000.00 | Strong | Major structural support zone representing the 2021 all-time highs; crucial for the breakout-retest thesis. |
| $56,604.00 | $56,000.00 - $57,208.00 | Strong | Confluence of the 50-month SMA (57,208) and the Lower Bollinger Band (56,021). |
Resistance Price Levels
| Level | Range | Strength | Notes |
|---|---|---|---|
| $90,128.00 | $90,128.00 - $90,128.00 | Strong | The 20-month SMA (Basis of Bollinger Bands), which now acts as dynamic overhead resistance. |
| $102,500.00 | $100,000.00 - $105,000.00 | Strong | Recent structural high and psychological round number resistance. |
Potential Chart Patterns in Formation
| Strength | Pattern | Signal | Target | Details |
|---|---|---|---|---|
| Strong | Breakout and Retest | Bullish | N/A | Price broke above the 2021 multi-year resistance (~69k) and is now pulling back to test this level as support. |
| Strong | Bearish MACD Crossover | Bearish | N/A | The MACD line has crossed below the Signal line on the monthly timeframe, indicating a shift in medium-term momentum. |
Frequently Asked Questions about BTC
What is the current sentiment for BTC?
The short-term sentiment for BTC is currently Bearish because Price has fallen below the 20-month SMA (90,128) and the MACD has confirmed a bearish crossover with a negative histogram (-4,543). RSI has dropped to neutral territory (47.64), indicating fading bullish momentum.. The long-term trend is classified as Bullish.
What are the key support levels for BTC?
StockDips.AI has identified key support levels for BTC at $64,500.00 and $56,604.00. These levels may represent potential accumulation zones where buying interest could emerge.
Is BTC in a significant dip or a Value Dip right now?
BTC has a Value Score of 54/100. It is not currently flagged as a significant dip in the Top Dips list. It is not listed as a Value Dip because the long-term sentiment or value-score threshold does not qualify.
View the full interactive analysis on StockDips.AI.