DOGE Weekly Technical Analysis
Dogecoin
A meme-inspired cryptocurrency with a strong community and fast transaction times.
DOGE Technical Analysis Summary
The weekly chart presents a heavily bearish technical picture, highlighted by the price trading beneath all major moving averages and a pending 'Death Cross' between the 50 and 200-week SMAs. Momentum indicators like MACD and RSI remain weak and in negative territory, suggesting continued downward pressure. Bulls need to decisively reclaim the 0.090-0.100 level to shift the short-term narrative, while failure to hold current levels risks a drop into the 0.055-0.065 macro support zone.
Included In Lists
Related Tickers of Interest
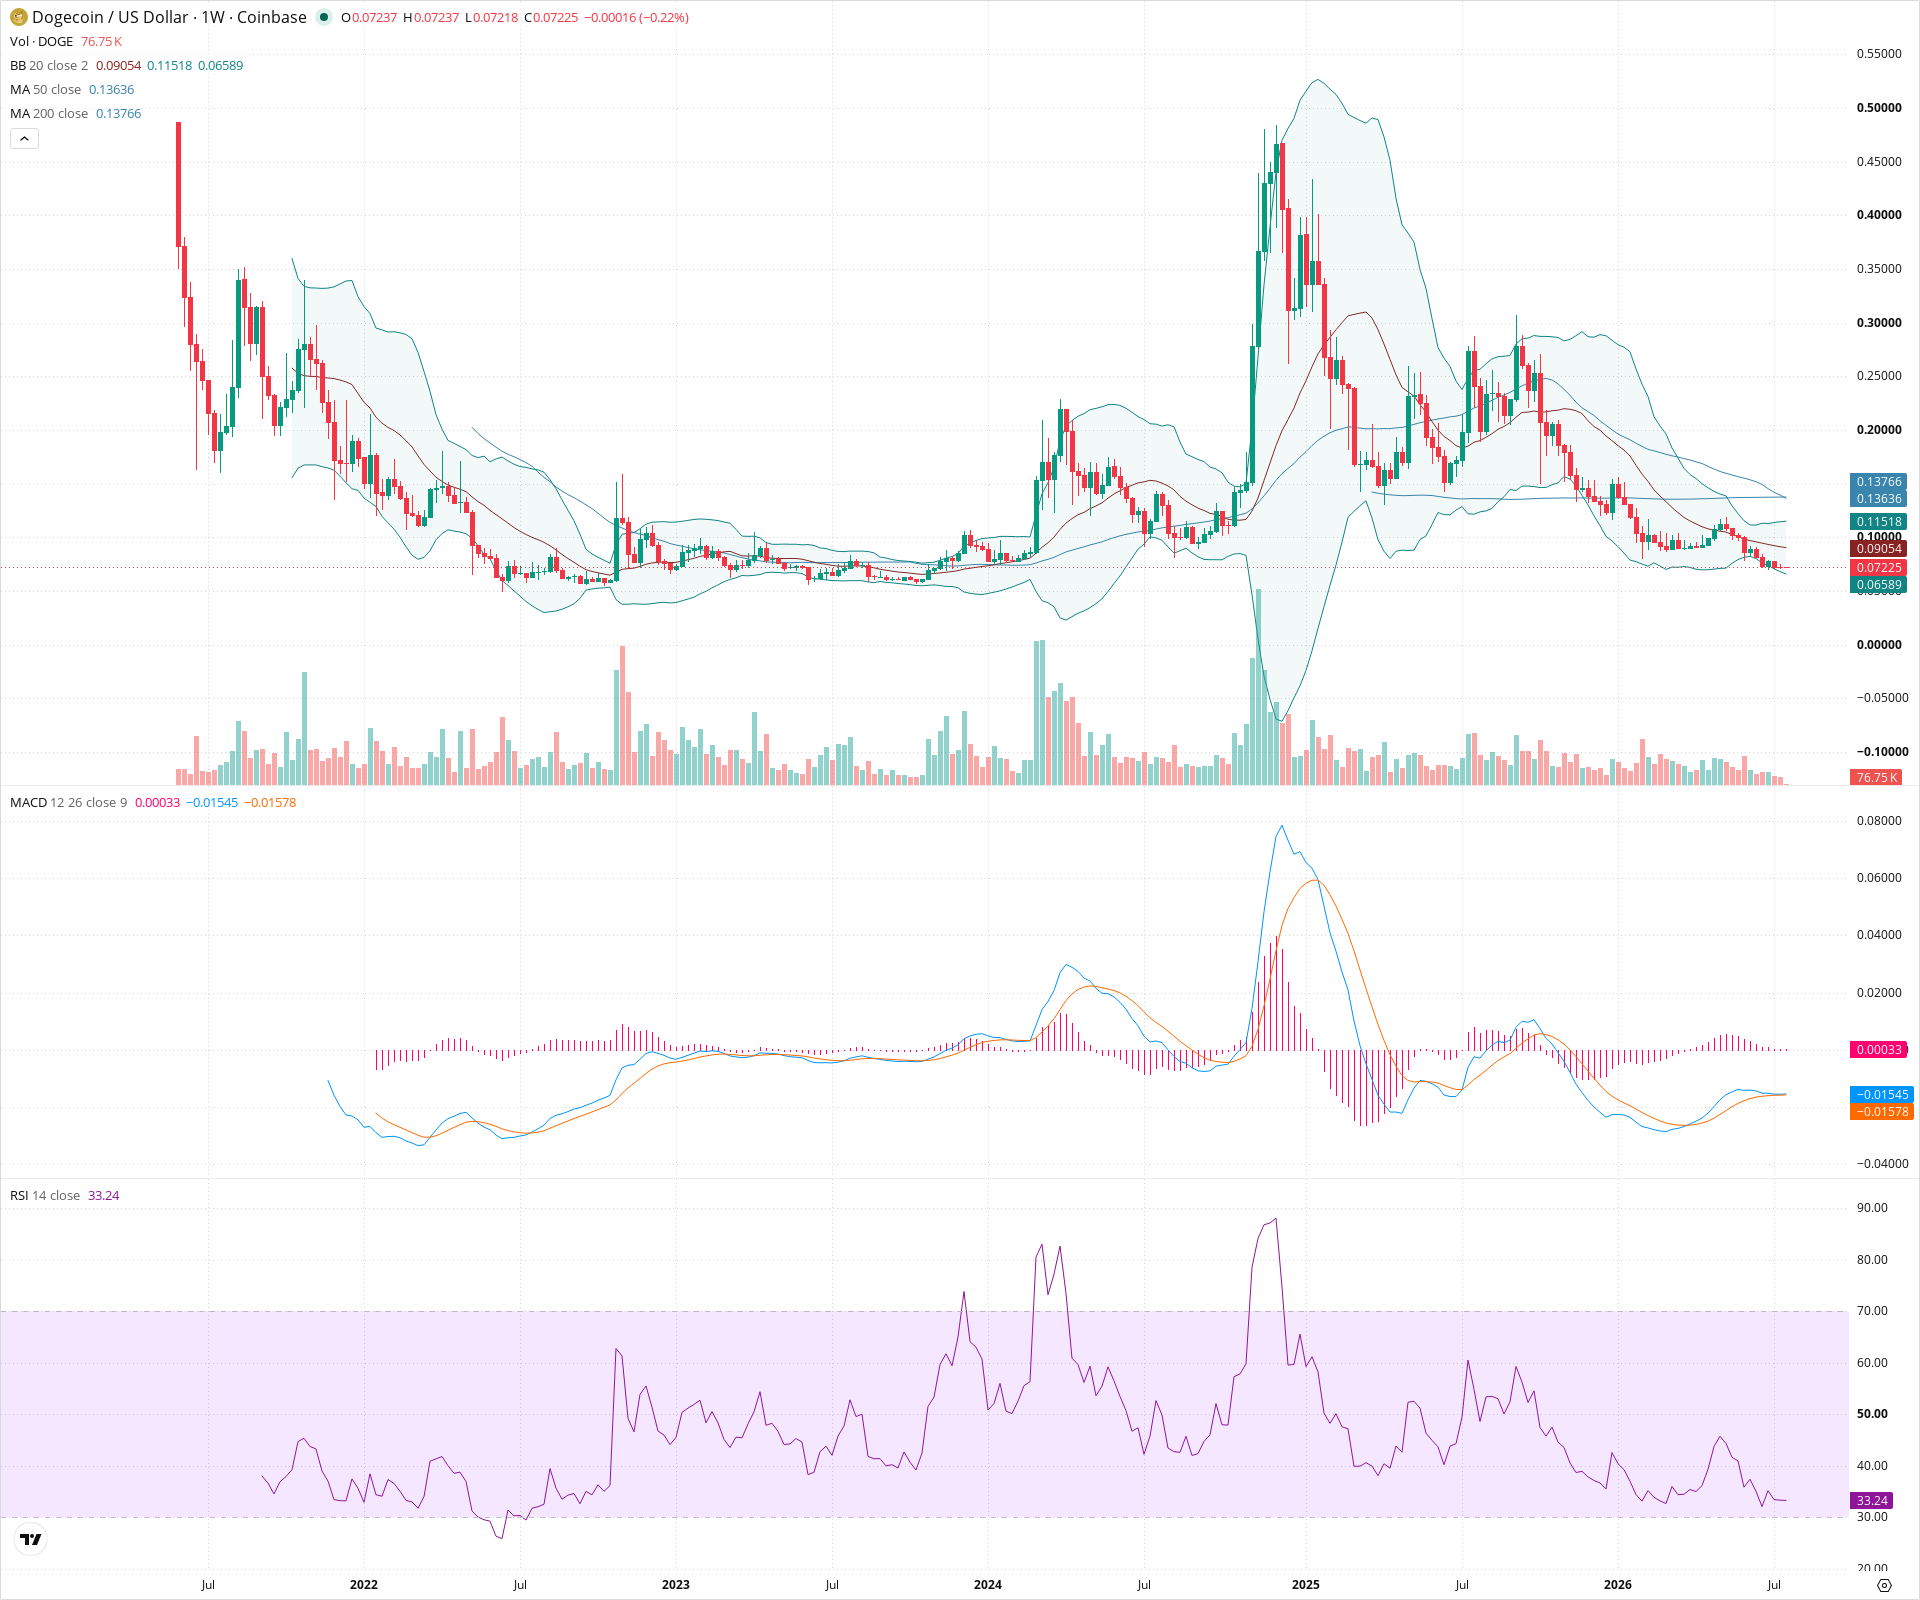
DOGE Weekly Chart
Sentiment
Short-term Sentiment (days to weeks): Bearish
Price is trending downwards, constrained by the lower half of the Bollinger Bands, and remains below the 20-week moving average. RSI is weak and approaching oversold levels at 33.
Long-term Sentiment (weeks to months): Bearish
The chart shows a clear macro downtrend of lower highs. The price is trading well below both the 50-week and 200-week SMAs, which are currently forming a bearish 'Death Cross'.
Report Metadata
- Timeframe: weekly
- Generated at: 2026-07-20T00:03:20.027Z
- Model: gemini-3.1-pro-preview
Support Price Levels
| Level | Range | Strength | Notes |
|---|---|---|---|
| $0.06 | $0.06 - $0.07 | Strong | Major historical consolidation zone and structural floor from previous multi-month ranges. |
| $0.05 | $0.05 - $0.05 | Weak | Extreme lower boundary of the previous long-term base before secondary run-ups. |
Resistance Price Levels
| Level | Range | Strength | Notes |
|---|---|---|---|
| $0.10 | $0.09 - $0.10 | Strong | Confluence of the 20-week SMA (Bollinger Band midline) and recent swing high resistance. |
| $0.14 | $0.14 - $0.15 | Strong | Massive overhead resistance zone containing both the 50-week and 200-week SMAs, acting as a heavy ceiling. |
Potential Chart Patterns in Formation
| Strength | Pattern | Signal | Target | Details |
|---|---|---|---|---|
| Strong | Death Cross | Bearish | N/A | The 50-week SMA is crossing below the 200-week SMA, indicating a shift to long-term bearish momentum. |
| Strong | Descending Triangle | Bearish | N/A | Price is forming a series of lower highs while pressing against a relatively flat or slightly descending support zone. |
Frequently Asked Questions about DOGE
What is the current sentiment for DOGE?
The short-term sentiment for DOGE is currently Bearish because Price is trending downwards, constrained by the lower half of the Bollinger Bands, and remains below the 20-week moving average. RSI is weak and approaching oversold levels at 33.. The long-term trend is classified as Bearish.
What are the key support levels for DOGE?
StockDips.AI has identified key support levels for DOGE at $0.06 and $0.05. These levels may represent potential accumulation zones where buying interest could emerge.
Is DOGE in a significant dip or a Value Dip right now?
DOGE has a Value Score of 39/100. It is not currently flagged as a significant dip in the Top Dips list. It is not listed as a Value Dip because the long-term sentiment or value-score threshold does not qualify.
View the full interactive analysis on StockDips.AI.