DOGE Monthly Technical Analysis
Dogecoin
A meme-inspired cryptocurrency with a strong community and fast transaction times.
DOGE Technical Analysis Summary
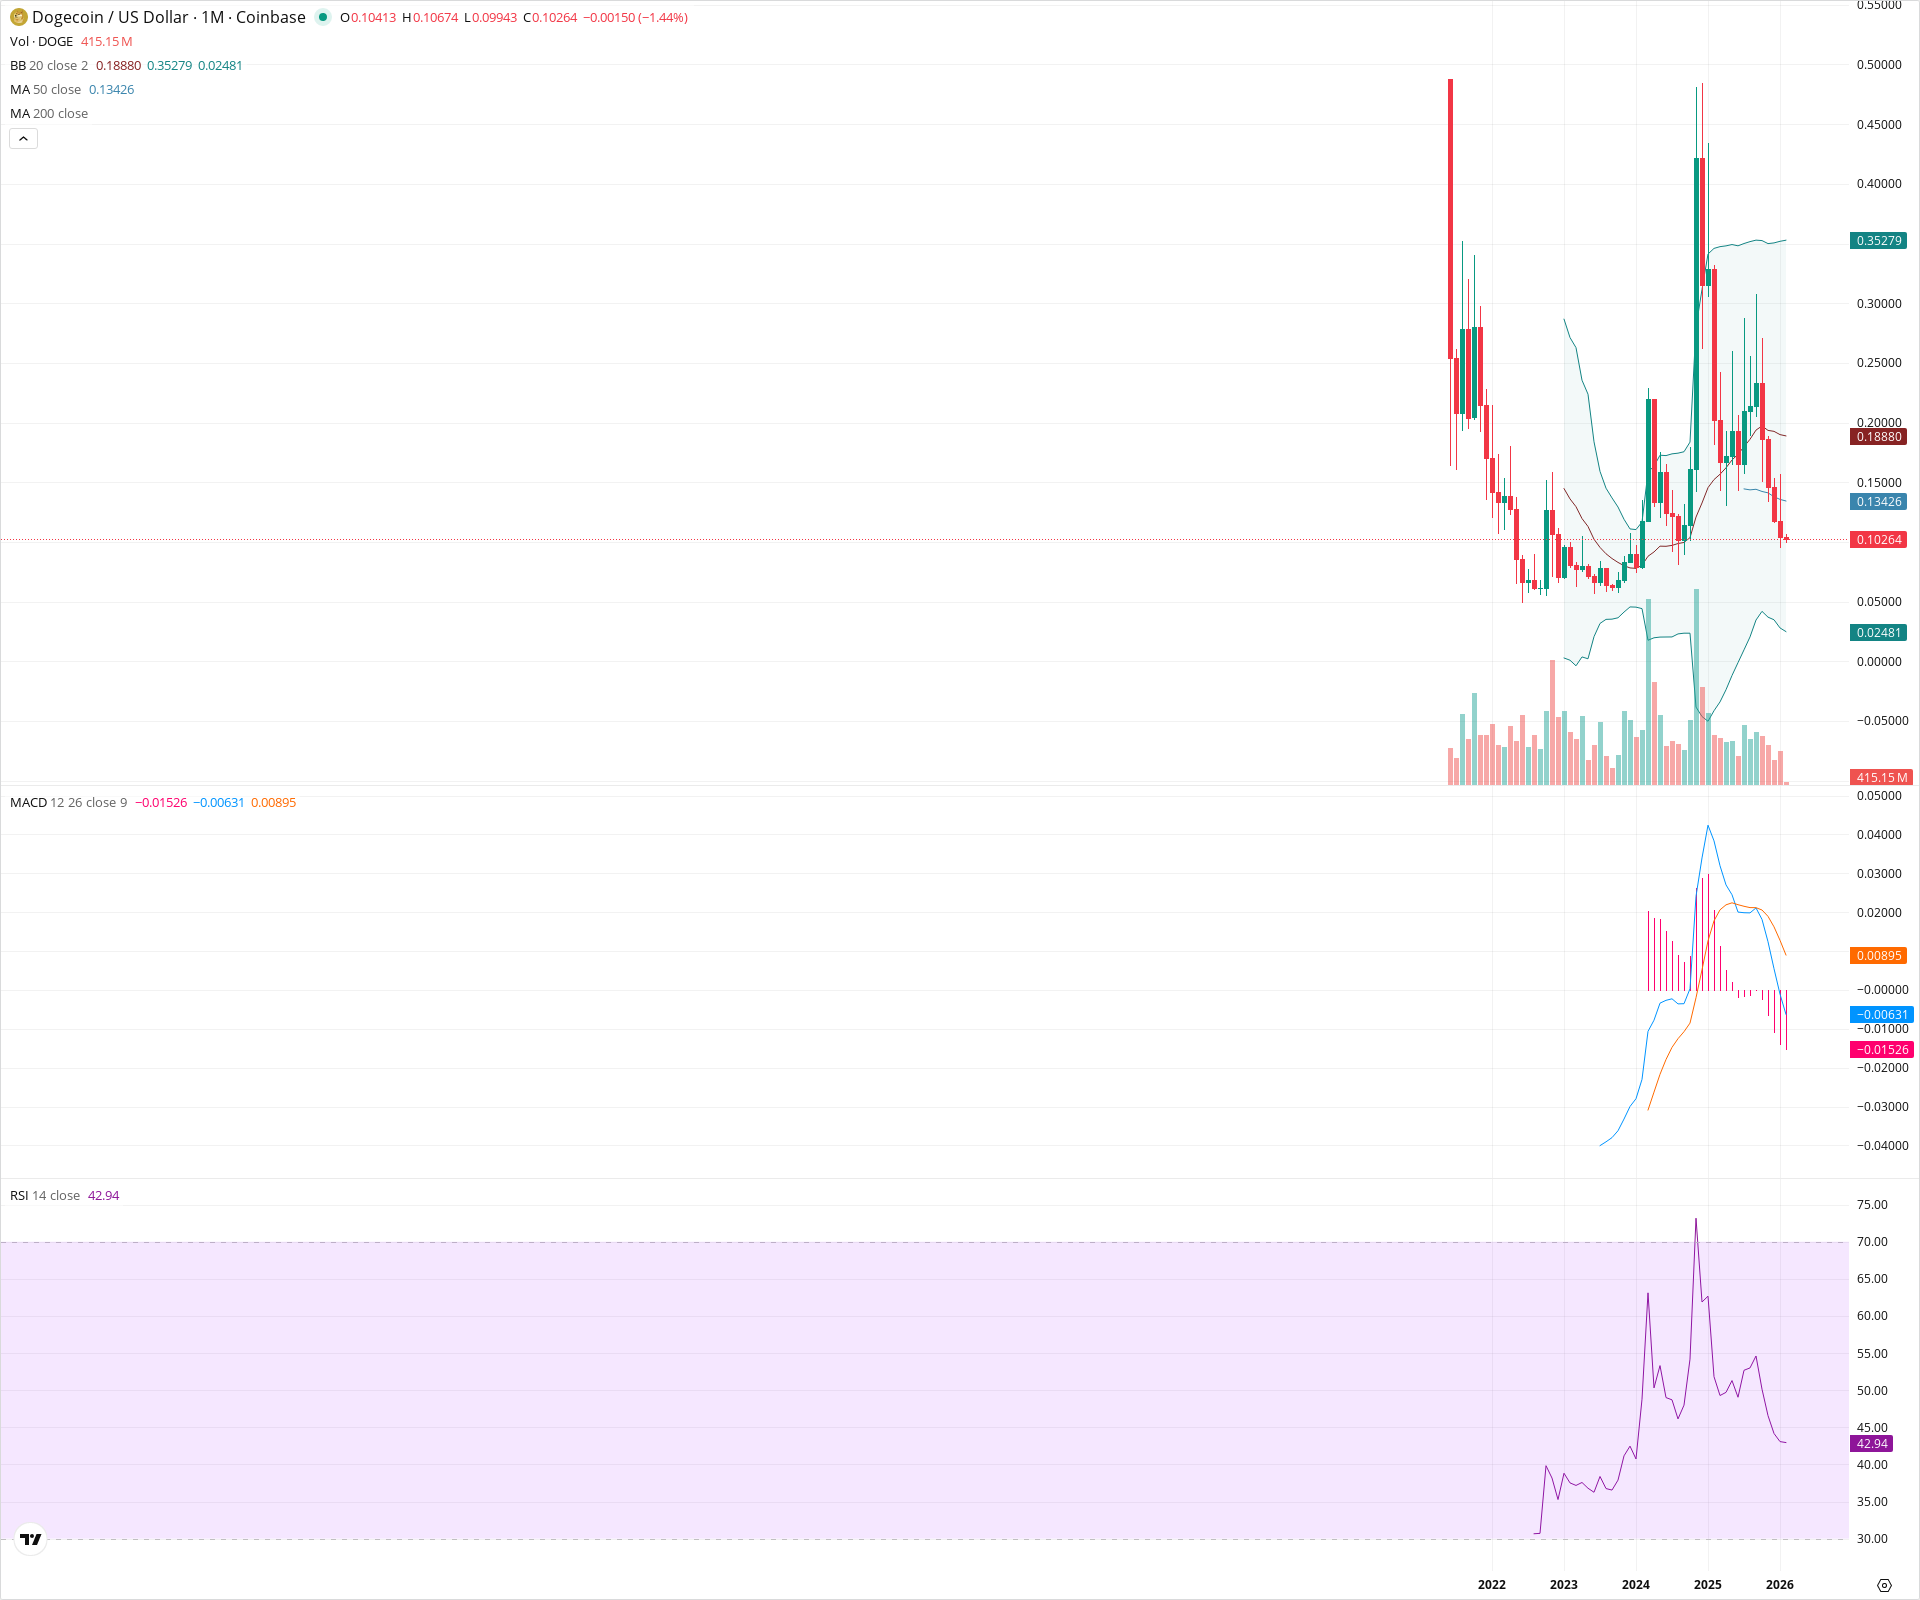
Dogecoin is currently undergoing a deep correction on the monthly chart, trading significantly below the 50-month SMA which now serves as overhead resistance. Momentum indicators are bearish, with the MACD line crossing below the signal line and the RSI drifting near 40, suggesting sellers are in control of the intermediate trend. While the long-term structure still resembles a massive accumulation base, the failure to sustain prices above 0.13 keeps the asset in a vulnerable position, risking a retest of secular support near 0.06.
Included In Lists
Related Tickers of Interest
DOGE Monthly Chart
Sentiment
Short-term Sentiment (days to weeks): Bearish
Price is trading below the 50-month SMA and the Bollinger Band basis. Momentum is negative with the monthly MACD line crossing below the signal line and dropping below zero, while RSI remains in bearish territory (<50).
Long-term Sentiment (weeks to months): Neutral
The asset is effectively range-bound, having retraced most of the 2024 breakout but remaining above the major secular cycle lows of 2022-2023. The structure resembles a long-term accumulation base that has yet to confirm a sustained trend reversal.
Report Metadata
- Timeframe: monthly
- Generated at: 2026-02-02T07:18:58.811Z
- Model: gemini-3-pro-preview
Support Price Levels
| Level | Range | Strength | Notes |
|---|---|---|---|
| $0.08 | $0.07 - $0.08 | Weak | Previous breakout level and consolidation zone top. |
| $0.06 | $0.05 - $0.06 | Strong | Major multi-year structural floor/cycle lows. |
Resistance Price Levels
| Level | Range | Strength | Notes |
|---|---|---|---|
| $0.13 | $0.13 - $0.14 | Strong | Dynamic resistance provided by the 50-month SMA. |
| $0.23 | $0.22 - $0.23 | Strong | Recent 2024 swing high and rejection point. |
| $0.35 | $0.35 - $0.36 | Strong | Upper Bollinger Band and historical structural resistance. |
Potential Chart Patterns in Formation
| Strength | Pattern | Signal | Target | Details |
|---|---|---|---|---|
| Strong | Rounding Bottom / Accumulation Base | Neutral | N/A | A multi-year U-shaped base structure formed throughout 2022 and 2023. |
| Weak | Deep Retracement | Bearish | $0.06 | Price has retraced a significant portion of the early 2024 impulse move, threatening to invalidate the breakout. |
Frequently Asked Questions about DOGE
What is the current sentiment for DOGE?
The short-term sentiment for DOGE is currently Bearish because Price is trading below the 50-month SMA and the Bollinger Band basis. Momentum is negative with the monthly MACD line crossing below the signal line and dropping below zero, while RSI remains in bearish territory (<50).. The long-term trend is classified as Neutral.
What are the key support levels for DOGE?
StockDips.AI has identified key support levels for DOGE at $0.08 and $0.06. These levels may represent potential accumulation zones where buying interest could emerge.
Is DOGE in a significant dip or a Value Dip right now?
DOGE has a Value Score of 36/100. It is not currently flagged as a significant dip in the Top Dips list. It is not listed as a Value Dip because the long-term sentiment or value-score threshold does not qualify.
View the full interactive analysis on StockDips.AI.