TRX Daily Technical Analysis
Tron
TRON (TRX) is a decentralized blockchain platform for content sharing and dApps, aiming to create a free digital entertainment ecosystem; TRX is its native utility token used for transactions, governance (staking/voting), and powering the network, known for high throughput and low fees.
TRX Technical Analysis Summary
TRX maintains a constructive long-term technical profile, anchored by its position above rising major moving averages. Currently, the asset is locked in a short-term consolidation phase, digesting previous volatility. Long-term investors should monitor the boundaries of the present trading range, as a definitive breakout will likely determine the next substantial directional trend.
Included In Lists
Related Tickers of Interest
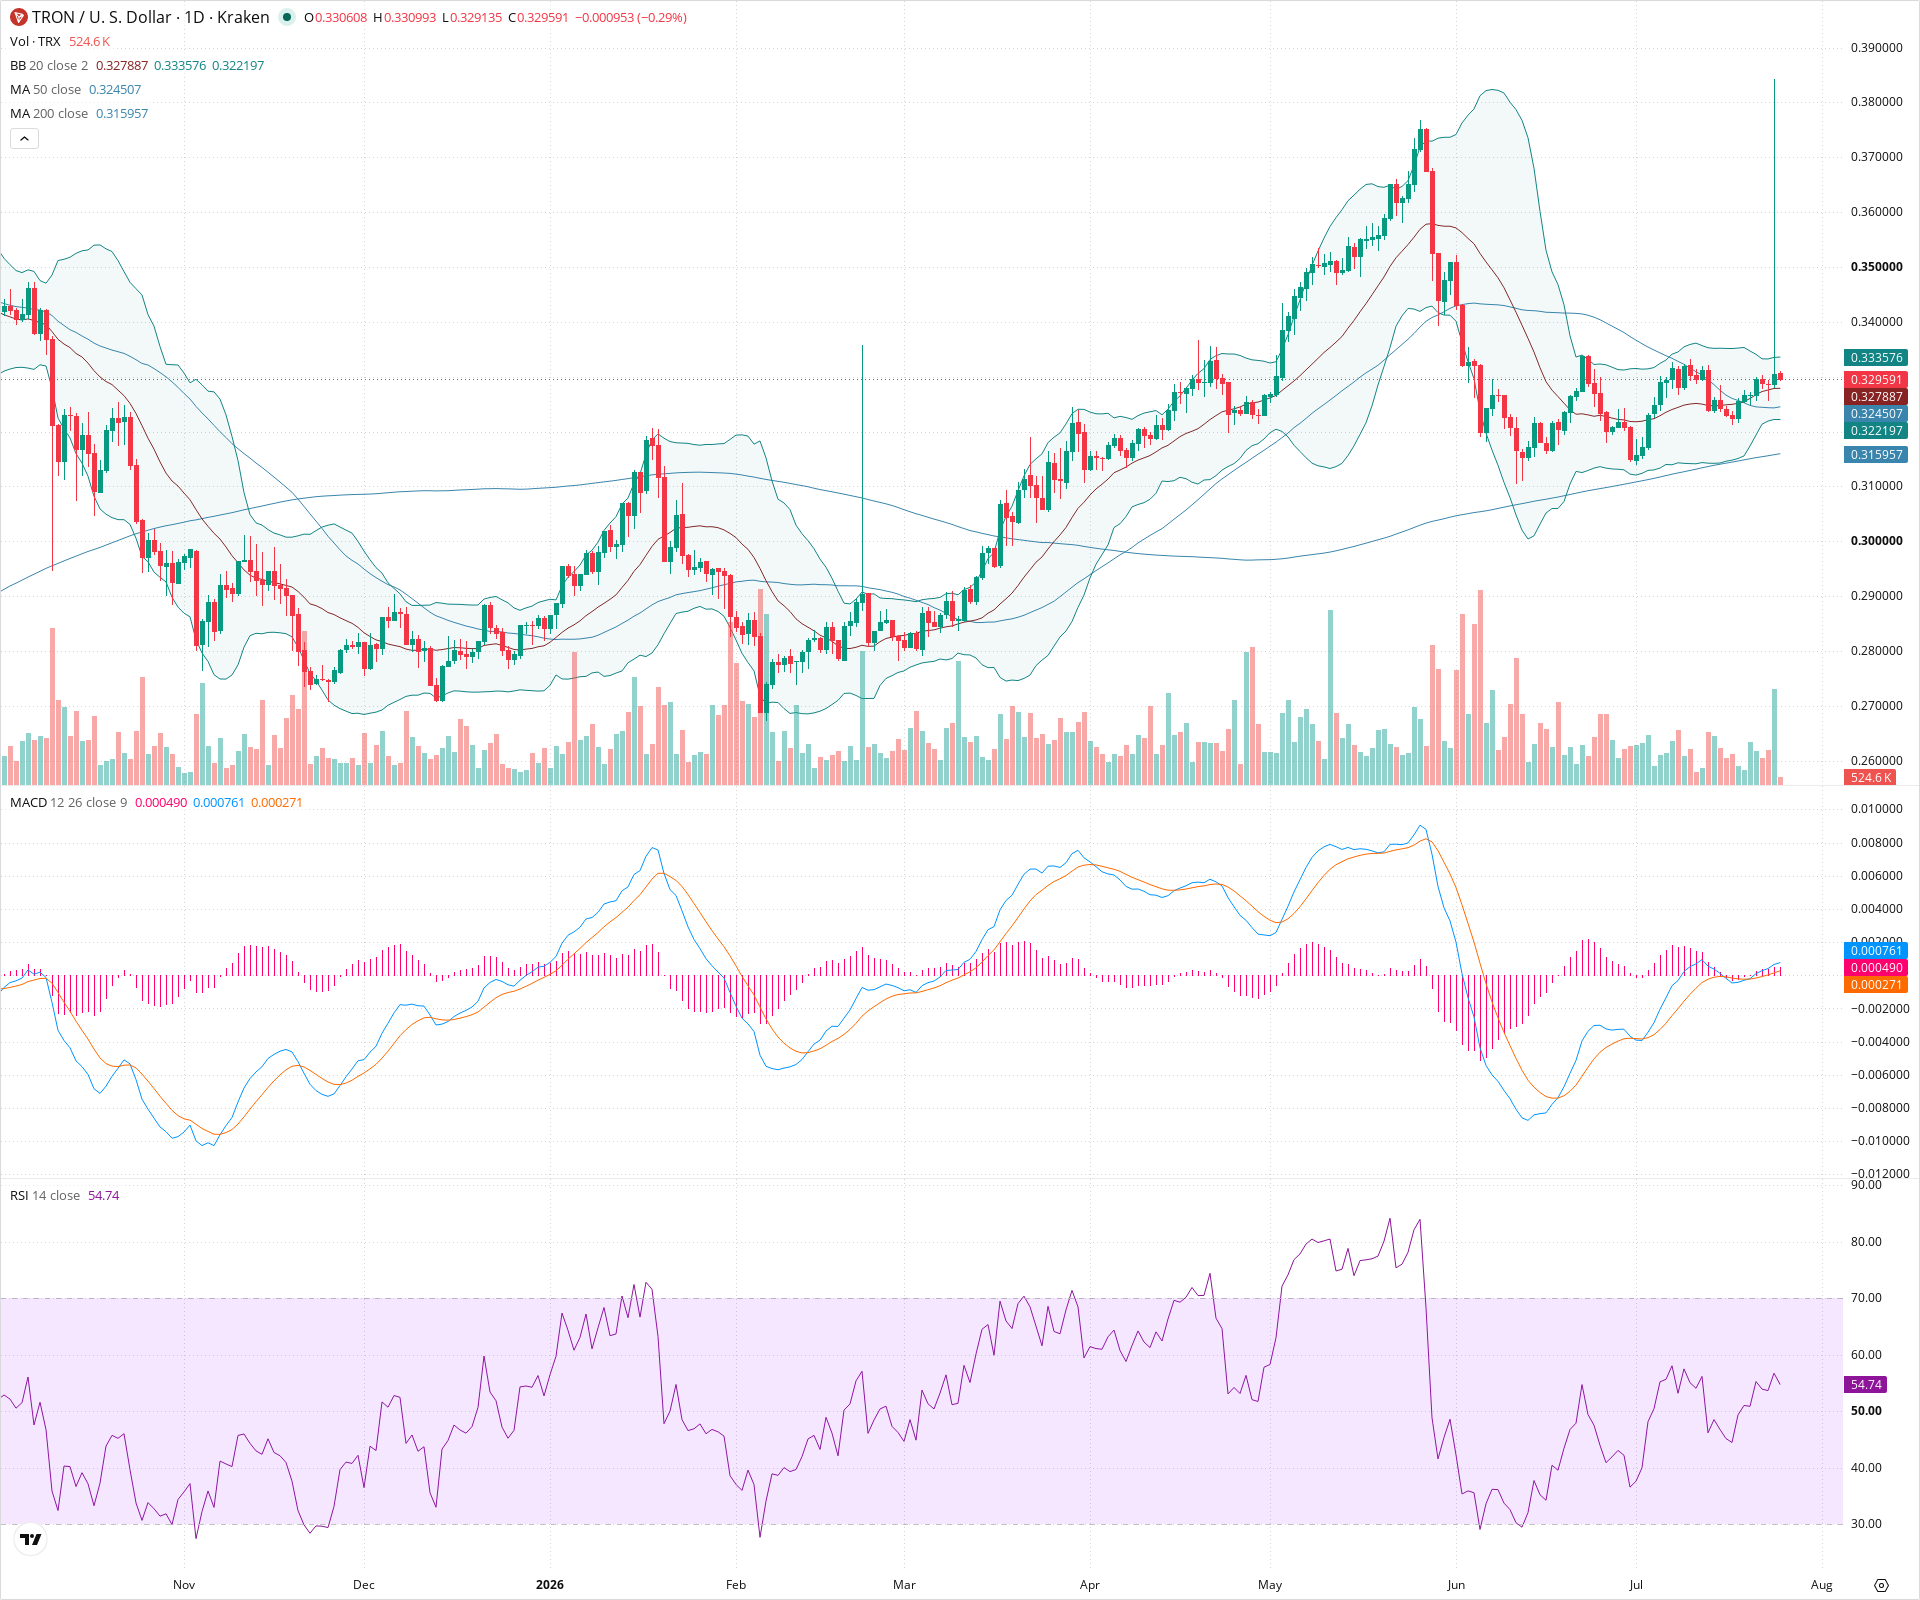
TRX Daily Chart
Sentiment
Short-term Sentiment (days to weeks): Neutral
Price is consolidating within a tightening range, holding above the 50-day SMA but struggling to break recent local highs. Momentum indicators like RSI (near 55) and MACD (flat histogram near zero line) reflect a lack of clear short-term directional conviction.
Long-term Sentiment (weeks to months): Bullish
The broader trend structure remains positive. The price is sustained above both the 50-day and 200-day simple moving averages, and both of these key long-term trend indicators are sloping upwards.
Report Metadata
- Timeframe: daily
- Generated at: 2026-07-25T12:01:53.599Z
- Model: gemini-3.1-pro-preview
Support Price Levels
| Level | Range | Strength | Notes |
|---|---|---|---|
| $0.32 | $0.32 - $0.33 | Strong | Zone encompassing the rising 50-day SMA and recent consolidation lows. |
| $0.31 | $0.30 - $0.32 | Strong | Major structural support zone aligning with the 200-day SMA and significant previous swing lows. |
Resistance Price Levels
| Level | Range | Strength | Notes |
|---|---|---|---|
| $0.34 | $0.34 - $0.34 | Strong | Immediate resistance area defined by recent local peaks and the upper Bollinger Band. |
| $0.38 | $0.37 - $0.38 | Strong | Major swing high established in late May. |
Potential Chart Patterns in Formation
| Strength | Pattern | Signal | Target | Details |
|---|---|---|---|---|
| Strong | Consolidation Range | Neutral | N/A | Following a sharp correction in June, the price action has settled into a tightening sideways range, characterized by contracting Bollinger Bands and declining volume, indicating a period of equilibrium between buyers and sellers. |
Frequently Asked Questions about TRX
What is the current sentiment for TRX?
The short-term sentiment for TRX is currently Neutral because Price is consolidating within a tightening range, holding above the 50-day SMA but struggling to break recent local highs. Momentum indicators like RSI (near 55) and MACD (flat histogram near zero line) reflect a lack of clear short-term directional conviction.. The long-term trend is classified as Bullish.
What are the key support levels for TRX?
StockDips.AI has identified key support levels for TRX at $0.32 and $0.31. These levels may represent potential accumulation zones where buying interest could emerge.
Is TRX in a significant dip or a Value Dip right now?
TRX has a Value Score of 97/100. It is currently flagged as a significant dip in the Top Dips list. It is also listed as a Value Dip because long-term sentiment is bullish.
View the full interactive analysis on StockDips.AI.