ETH Weekly Technical Analysis
Ethereum
Blockchain platform that enables smart contracts and decentralized applications (dApps).
ETH Technical Analysis Summary
ETH is currently in a sideways consolidation phase on the weekly chart, trading between major support at 1530 and resistance around 2150. While short-term momentum is flat, the long-term structure remains bullish as long as price holds above the multi-year support zones.
Included In Lists
Related Tickers of Interest
ETH Weekly Chart
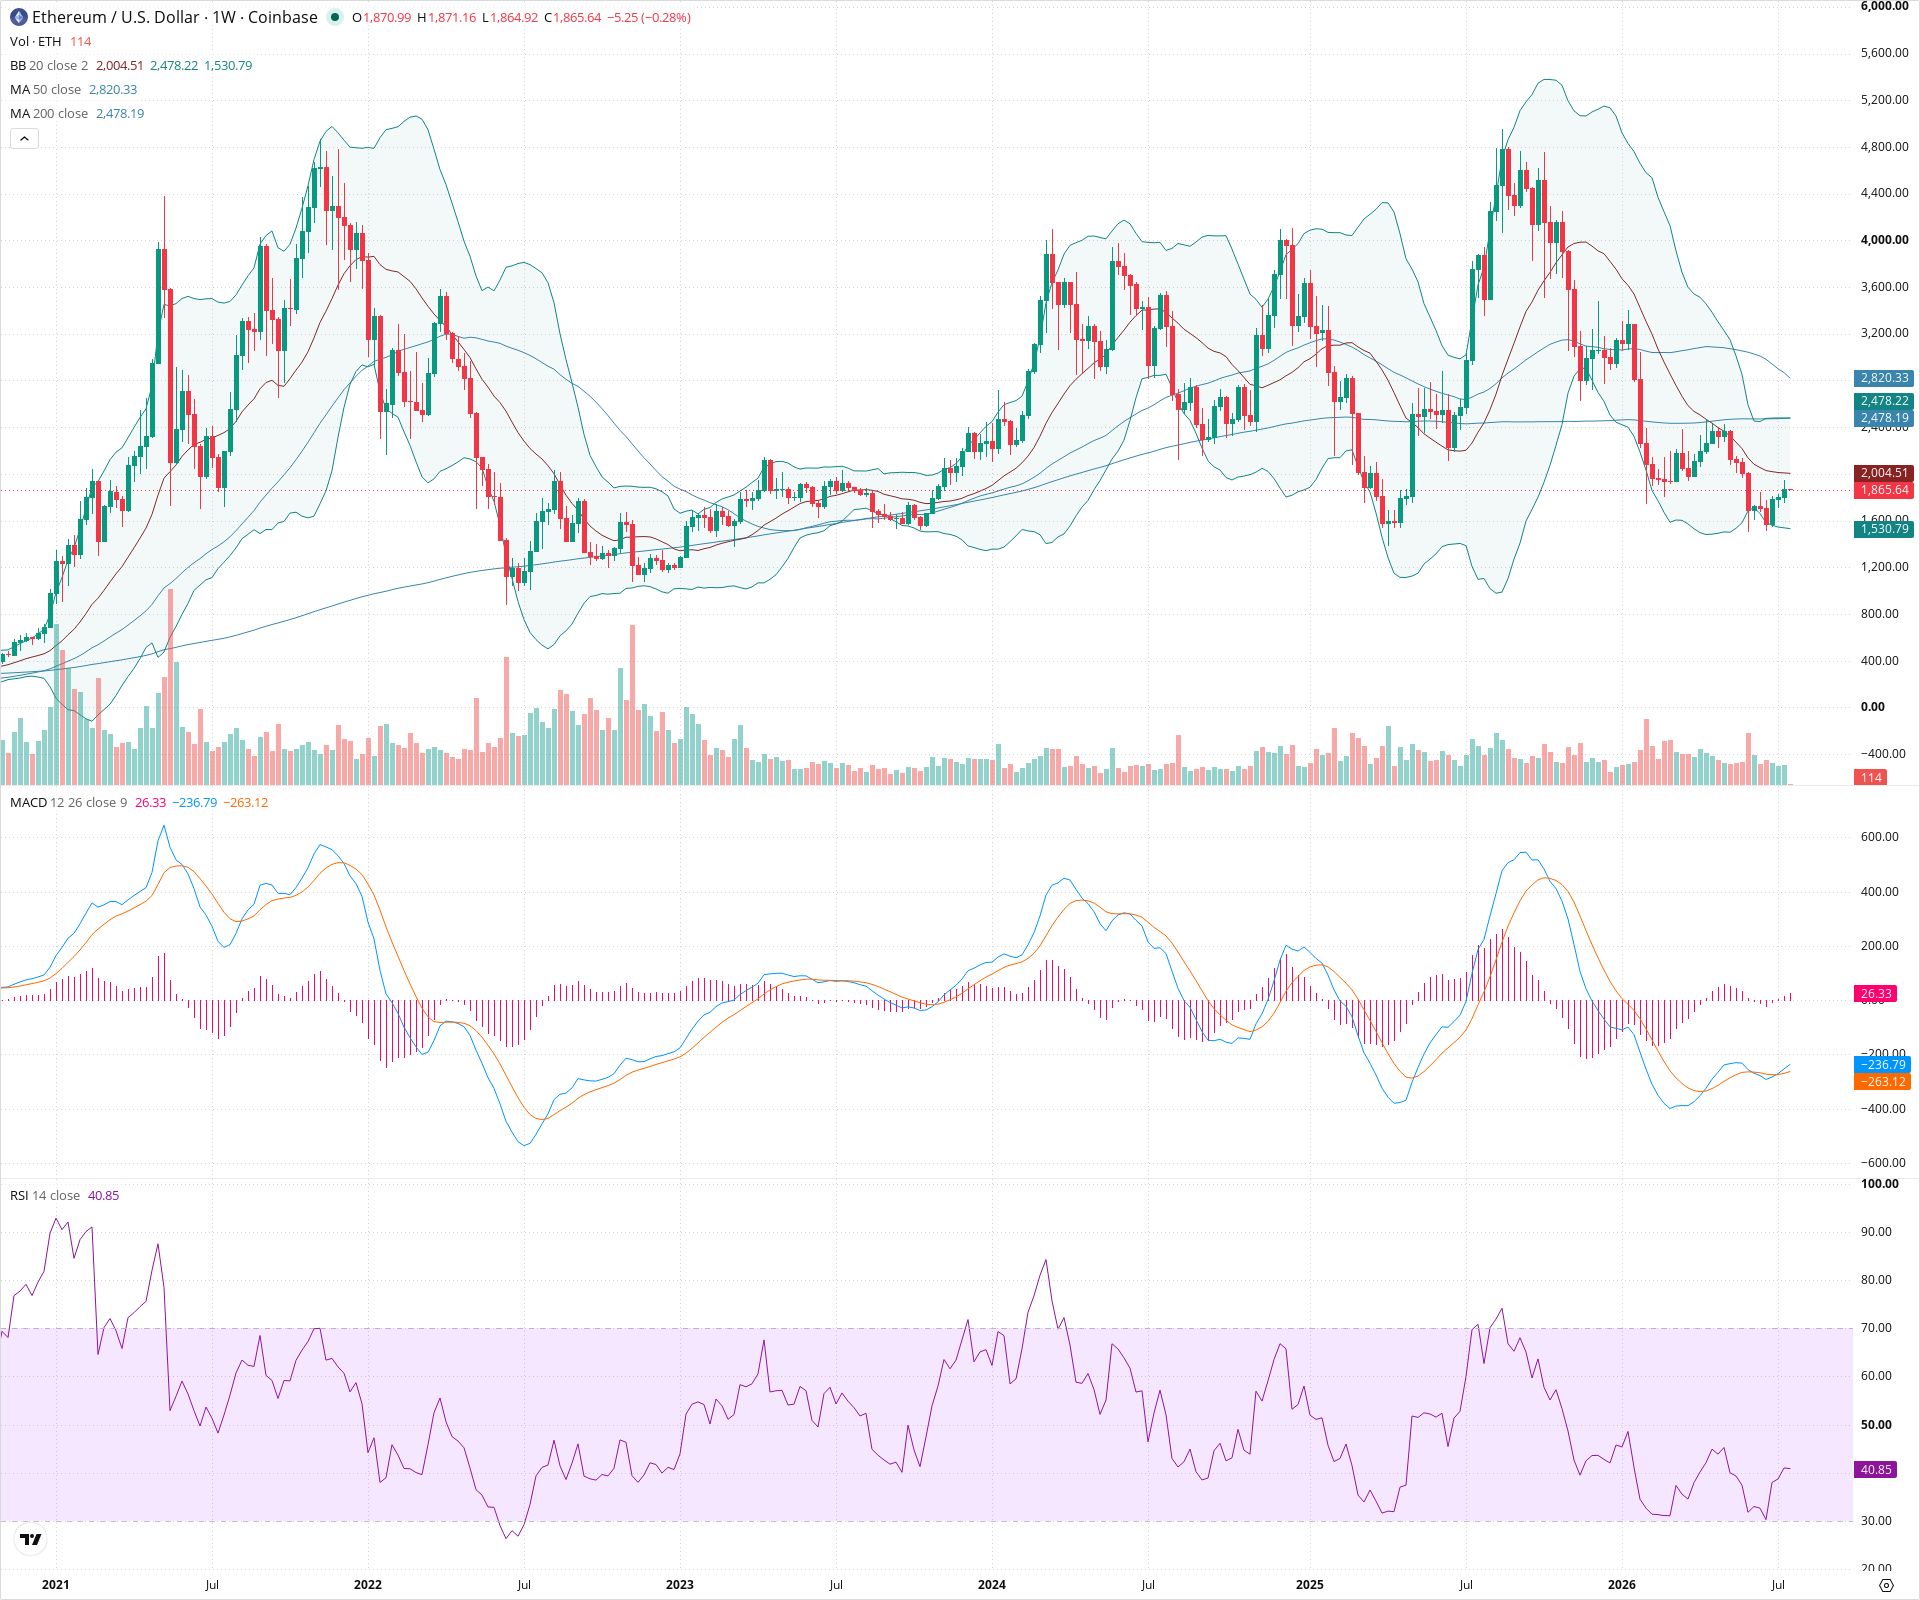
Sentiment
Short-term Sentiment (days to weeks): Neutral
Price is consolidating within a narrow range between the 50-week and 200-week SMAs. MACD histogram is flat and near zero, indicating a lack of momentum.
Long-term Sentiment (weeks to months): Bullish
Price remains above the 200-week SMA, and a long-term uptrend structure is still intact with higher lows since the major bottom.
Report Metadata
- Timeframe: weekly
- Generated at: 2026-07-20T00:02:30.129Z
- Model: gemini-3.1-pro-preview
Support Price Levels
| Level | Range | Strength | Notes |
|---|---|---|---|
| $1,565.40 | $1,530.79 - $1,600.00 | Strong | Major prior swing low and area of historical consolidation. |
| $900.00 | $800.00 - $1,000.00 | Strong | Multi-year structural bottom. |
Resistance Price Levels
| Level | Range | Strength | Notes |
|---|---|---|---|
| $2,077.26 | $2,004.51 - $2,150.00 | Strong | Recent swing high, Bollinger Band midline, and psychological resistance. |
| $2,489.10 | $2,478.19 - $2,500.00 | Strong | Confluence of the 200-week SMA and previous structural highs. |
Potential Chart Patterns in Formation
| Strength | Pattern | Signal | Target | Details |
|---|---|---|---|---|
| Strong | Consolidation Range | Neutral | N/A | Price is moving sideways in a clear range, finding support near 1530 and resistance around 2150. |
Frequently Asked Questions about ETH
What is the current sentiment for ETH?
The short-term sentiment for ETH is currently Neutral because Price is consolidating within a narrow range between the 50-week and 200-week SMAs. MACD histogram is flat and near zero, indicating a lack of momentum.. The long-term trend is classified as Bullish.
What are the key support levels for ETH?
StockDips.AI has identified key support levels for ETH at $1,565.40 and $900.00. These levels may represent potential accumulation zones where buying interest could emerge.
Is ETH in a significant dip or a Value Dip right now?
ETH has a Value Score of 46/100. It is not currently flagged as a significant dip in the Top Dips list. It is not listed as a Value Dip because the long-term sentiment or value-score threshold does not qualify.
View the full interactive analysis on StockDips.AI.