ETH Monthly Technical Analysis
Ethereum
Blockchain platform that enables smart contracts and decentralized applications (dApps).
ETH Technical Analysis Summary
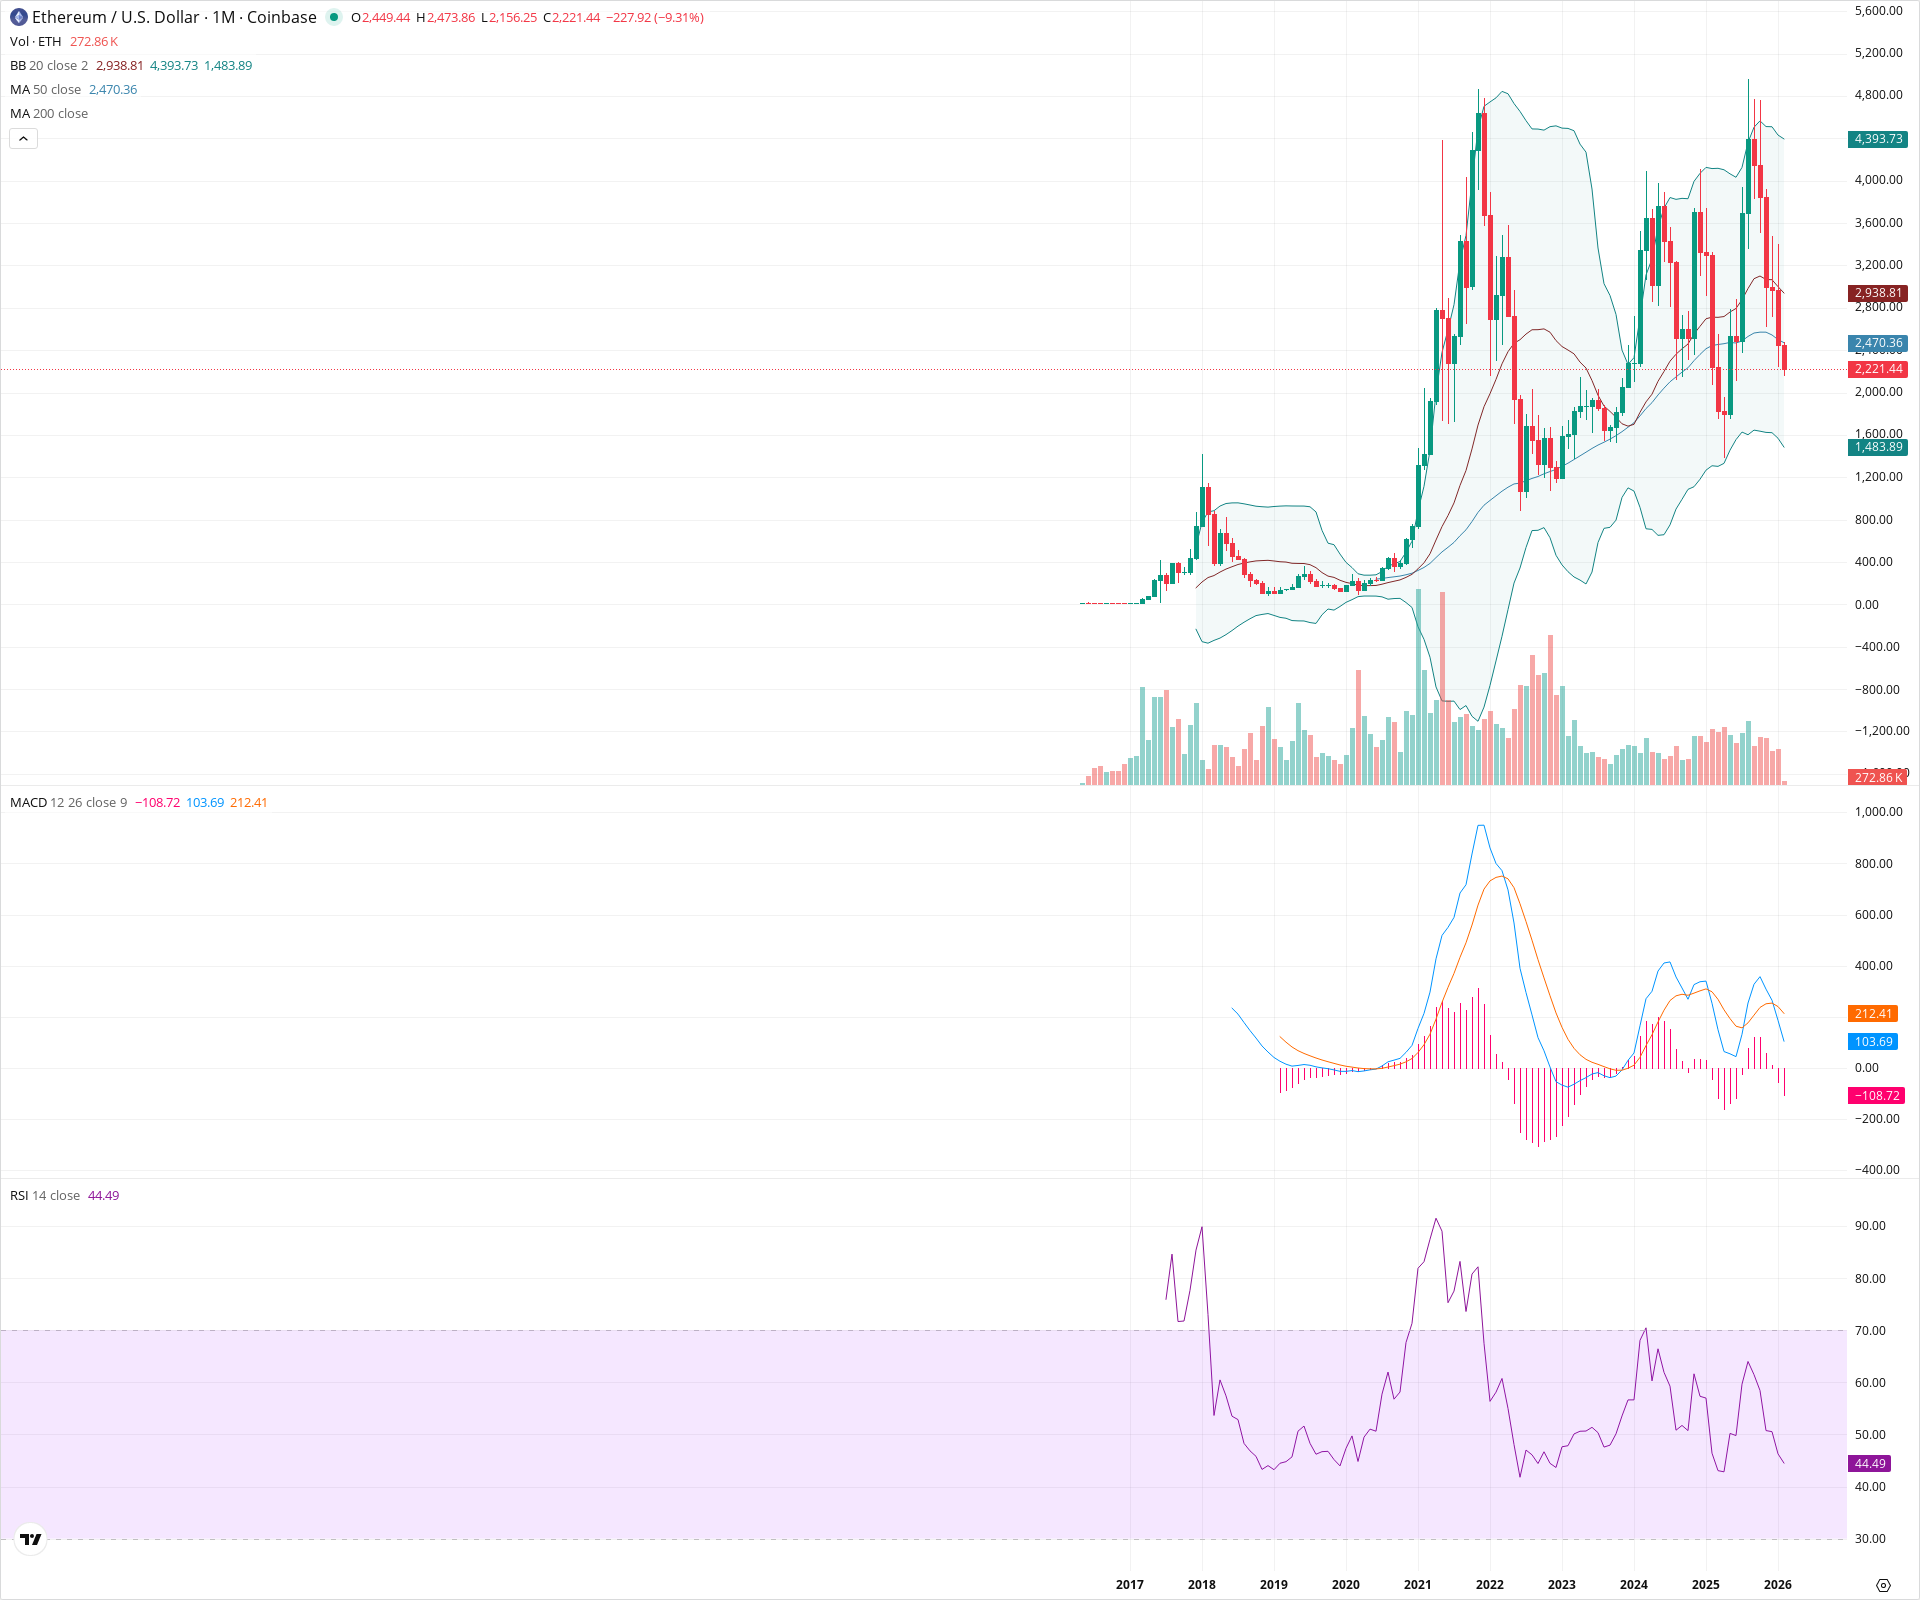
Ethereum is currently in a corrective phase on the monthly timeframe, evidenced by trading below the 50-month SMA and a bearish MACD crossover. The price is testing a critical support zone around 2,200, which served as the ceiling for the 2022-2023 consolidation; holding this level is essential to maintain a bullish macro thesis. A failure here could see price revert toward the lower Bollinger Band near 1,500, while reclaiming the 2,470–2,940 zone is necessary to restore bullish momentum.
Included In Lists
Related Tickers of Interest
ETH Monthly Chart
Sentiment
Short-term Sentiment (days to weeks): Bearish
Price has dropped below the 50-month SMA and the Bollinger Band basis (20 SMA). The monthly MACD has crossed downwards with a widening negative histogram, and recent candles show strong selling pressure.
Long-term Sentiment (weeks to months): Neutral
While the asset remains above the major cyclical lows of 2022, the failure to create a new all-time high in 2024 (forming a lower high at ~4,100) and the loss of the 50-month moving average suggest a weakening macro trend.
Report Metadata
- Timeframe: monthly
- Generated at: 2026-02-02T07:19:00.812Z
- Model: gemini-3-pro-preview
Support Price Levels
| Level | Range | Strength | Notes |
|---|---|---|---|
| $2,100.00 | $2,000.00 - $2,200.00 | Strong | Current retest zone; previously a major resistance ceiling during the 2022-2023 consolidation. |
| $1,500.00 | $1,400.00 - $1,600.00 | Strong | Aligns with the lower Bollinger Band and historical accumulation zones. |
| $940.00 | $880.00 - $1,000.00 | Strong | Major secular cycle lows established in 2022. |
Resistance Price Levels
| Level | Range | Strength | Notes |
|---|---|---|---|
| $2,705.00 | $2,470.00 - $2,940.00 | Strong | Confluence of the 50-month SMA and the 20-month SMA (Bollinger basis). |
| $4,000.00 | $3,900.00 - $4,100.00 | Strong | Recent swing high from early 2024. |
| $4,850.00 | $4,800.00 - $4,900.00 | Strong | All-time high zone from 2021. |
Potential Chart Patterns in Formation
| Strength | Pattern | Signal | Target | Details |
|---|---|---|---|---|
| Strong | Macro Lower High | Bearish | N/A | The 2024 peak near 4,000 failed to exceed the 2021 peak of ~4,800, creating a large-scale lower high structure on the monthly chart. |
| Weak | Breakout Retest | Neutral | N/A | Price broke out of a multi-year base (2022-2023) and is now falling back to test the top of that base (~2,100) as support. |
Frequently Asked Questions about ETH
What is the current sentiment for ETH?
The short-term sentiment for ETH is currently Bearish because Price has dropped below the 50-month SMA and the Bollinger Band basis (20 SMA). The monthly MACD has crossed downwards with a widening negative histogram, and recent candles show strong selling pressure.. The long-term trend is classified as Neutral.
What are the key support levels for ETH?
StockDips.AI has identified key support levels for ETH at $2,100.00 and $1,500.00. These levels may represent potential accumulation zones where buying interest could emerge.
Is ETH in a significant dip or a Value Dip right now?
ETH has a Value Score of 45/100. It is not currently flagged as a significant dip in the Top Dips list. It is not listed as a Value Dip because the long-term sentiment or value-score threshold does not qualify.
View the full interactive analysis on StockDips.AI.